The ConCord Transmission Atlas of the United States
Electric transmission lines are linear infrastructure that stretch across every state in America. They connect electricity generators to electric demand in our homes and businesses through a network of substations and lines called the electric grid.
Through original geospatial data analysis, Pacific Northwest National Laboratory estimates that the transmission network within all fifty United States, including Puerto Rico, Washington D.C., and Guam, spans 11 million acres in corridor space and 589,116 miles in line length. Using the 2020 U.S. Census data, over 226 million people live within one mile of a transmission line—this is almost two-thirds of the entire American population.
Due to their linearity, scale, and uniformity, transmission powerlines (the largest type of powerlines that transits the greatest amount of energy) and the work they do can be hard to “see” in their entirety. Power lines do not perfectly conform to common geographic boundaries or throughways, such as roads. But the way they network across the landscape does have a story.
To represent the relationships between transmission powerlines and geographical features, Pacific Northwest National Laboratory is building a library of detailed maps and compiling them into an atlas. The atlas visually illustrates the complex relationships between transmission lines, ecosystems, and human activities. It provides valuable insight not readily available elsewhere and contextualizes how transmission infrastructure can interact with its surroundings, both natural and human.
As part of the Connecting Transmission Corridors (ConCord) Initiative, this body of GIS knowledge and insights can inform communities and decision-makers on transmission deployment approaches that combine public and environmental benefits with national interests in infrastructure. The ConCord project is an initiative through the U.S. Department of Energy's Office of Electricity, led by Pacific Northwest National Laboratory to investigate the full range of local benefits that can be enabled through corridor investments. Recreation, ecosystem services, and local wealth-building are three types of public benefits that can be planned in powerline corridors to supplement the reliability, energy, and carbon benefits of the lines themselves.
Click on the link below each of the thumbnails to view a high-resolution rendering along with a detailed description of the data depicted in each map.
Check back often for new maps, new data, and new insights.
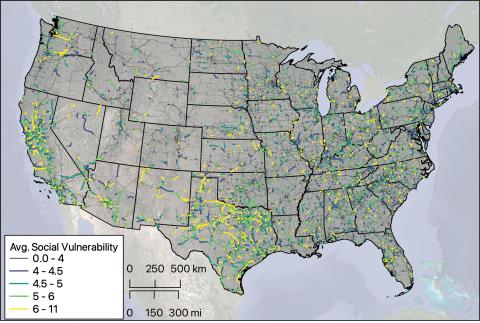 Transmission and average CDC's Social Vulnerability Index (SVI). | 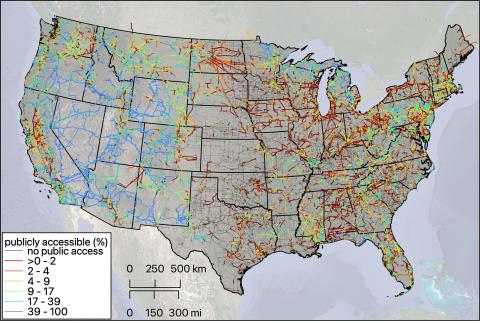 Public access portions of transmission lines. | 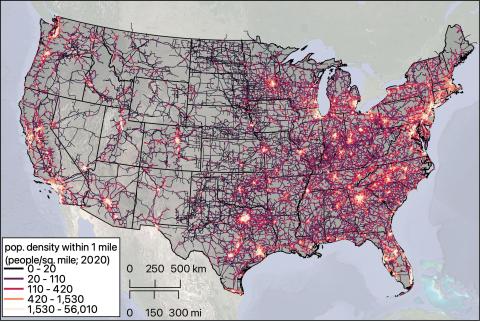 Population within one mile buffer. |
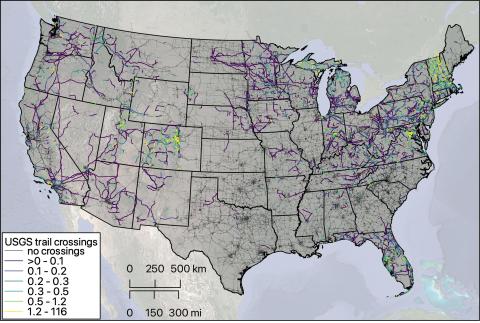 Trail crossing through transmission lines. | 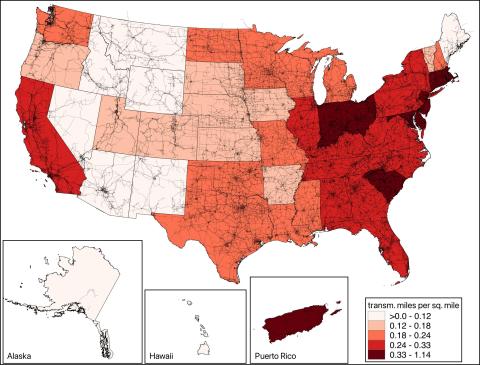 Transmission length by state area. | 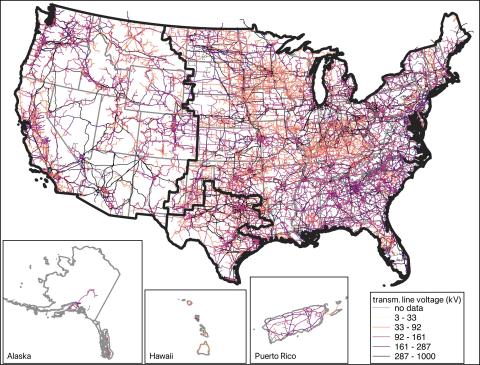 Transmission lines by Interconnect. |
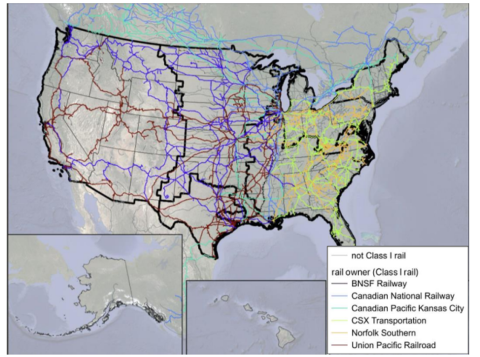 Transmission lines and freight railroads. | 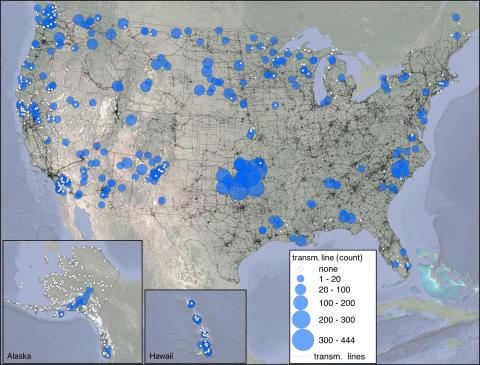 Tribal land intersection with transmission. |
Voltage Line Maps
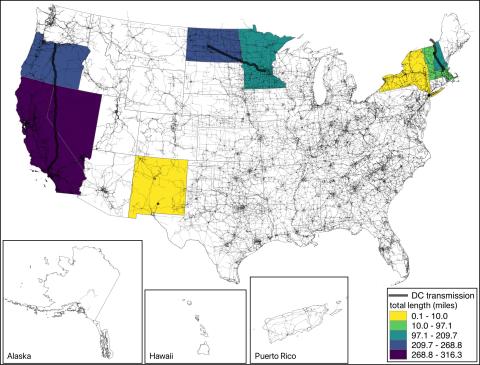 Direct transmission line by state. Click to enlarge. | 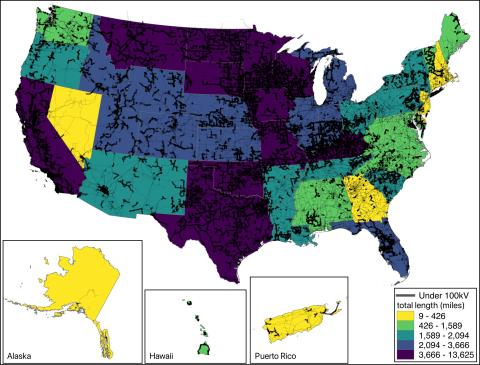 Transmission voltages under 100kV by state. | 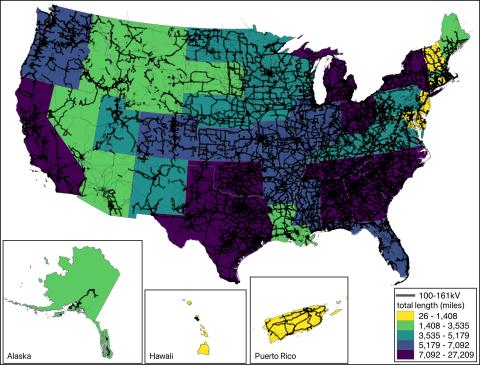 Transmission voltages between 100-161kV by state. Click to enlarge. |
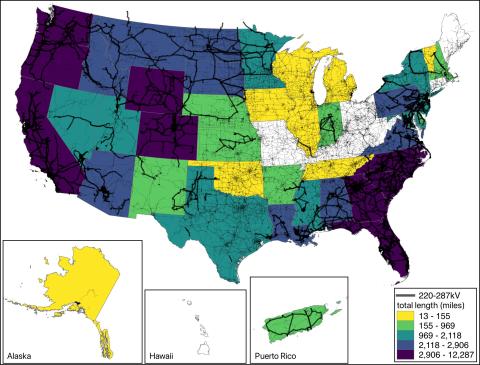 Transmission voltages between 220-287 kV by state. Click to enlarge. | 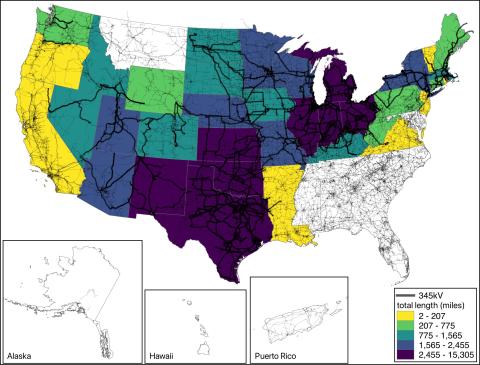 Transmission voltages of 345 kV by state. Click to enlarge. | 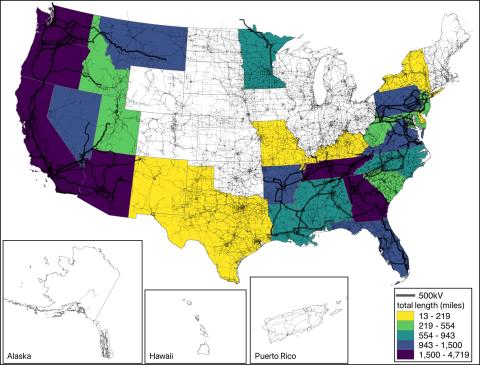 Transmission voltages of 500 kV by state. Click to enlarge. |
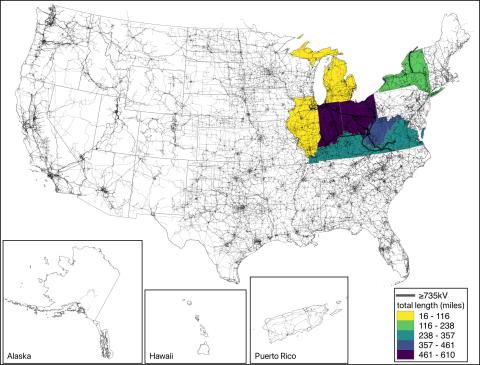 Transmission voltages of ≥735 kV by state. Click to enlarge. | 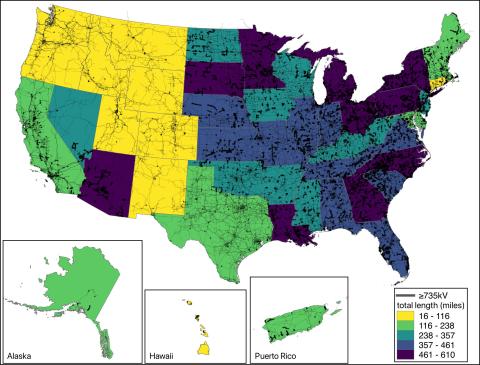 Transmission lines where there is no voltage identified. Click to enlarge. |
Wildfire Risk Maps
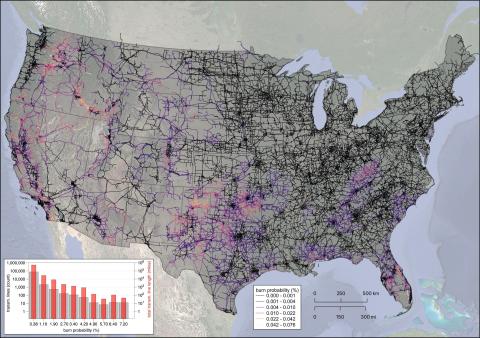 Average burn probability along each transmission line. Click to enlarge. | 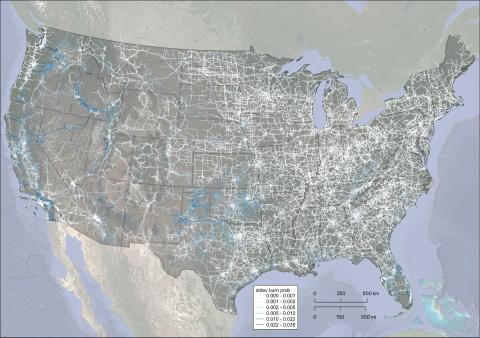 Standard deviation of burn probability along each transmission line. Click to enlarge. | 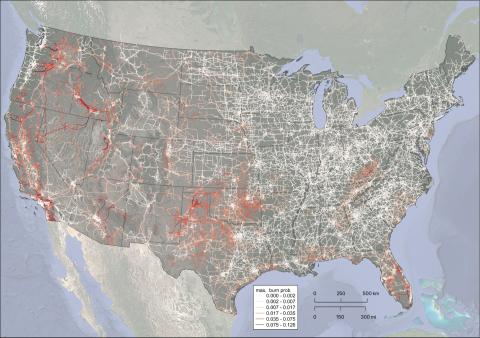 Maximum burn probability (single value) along each transmission line. Click to enlarge. |
PNNL-SA-210071