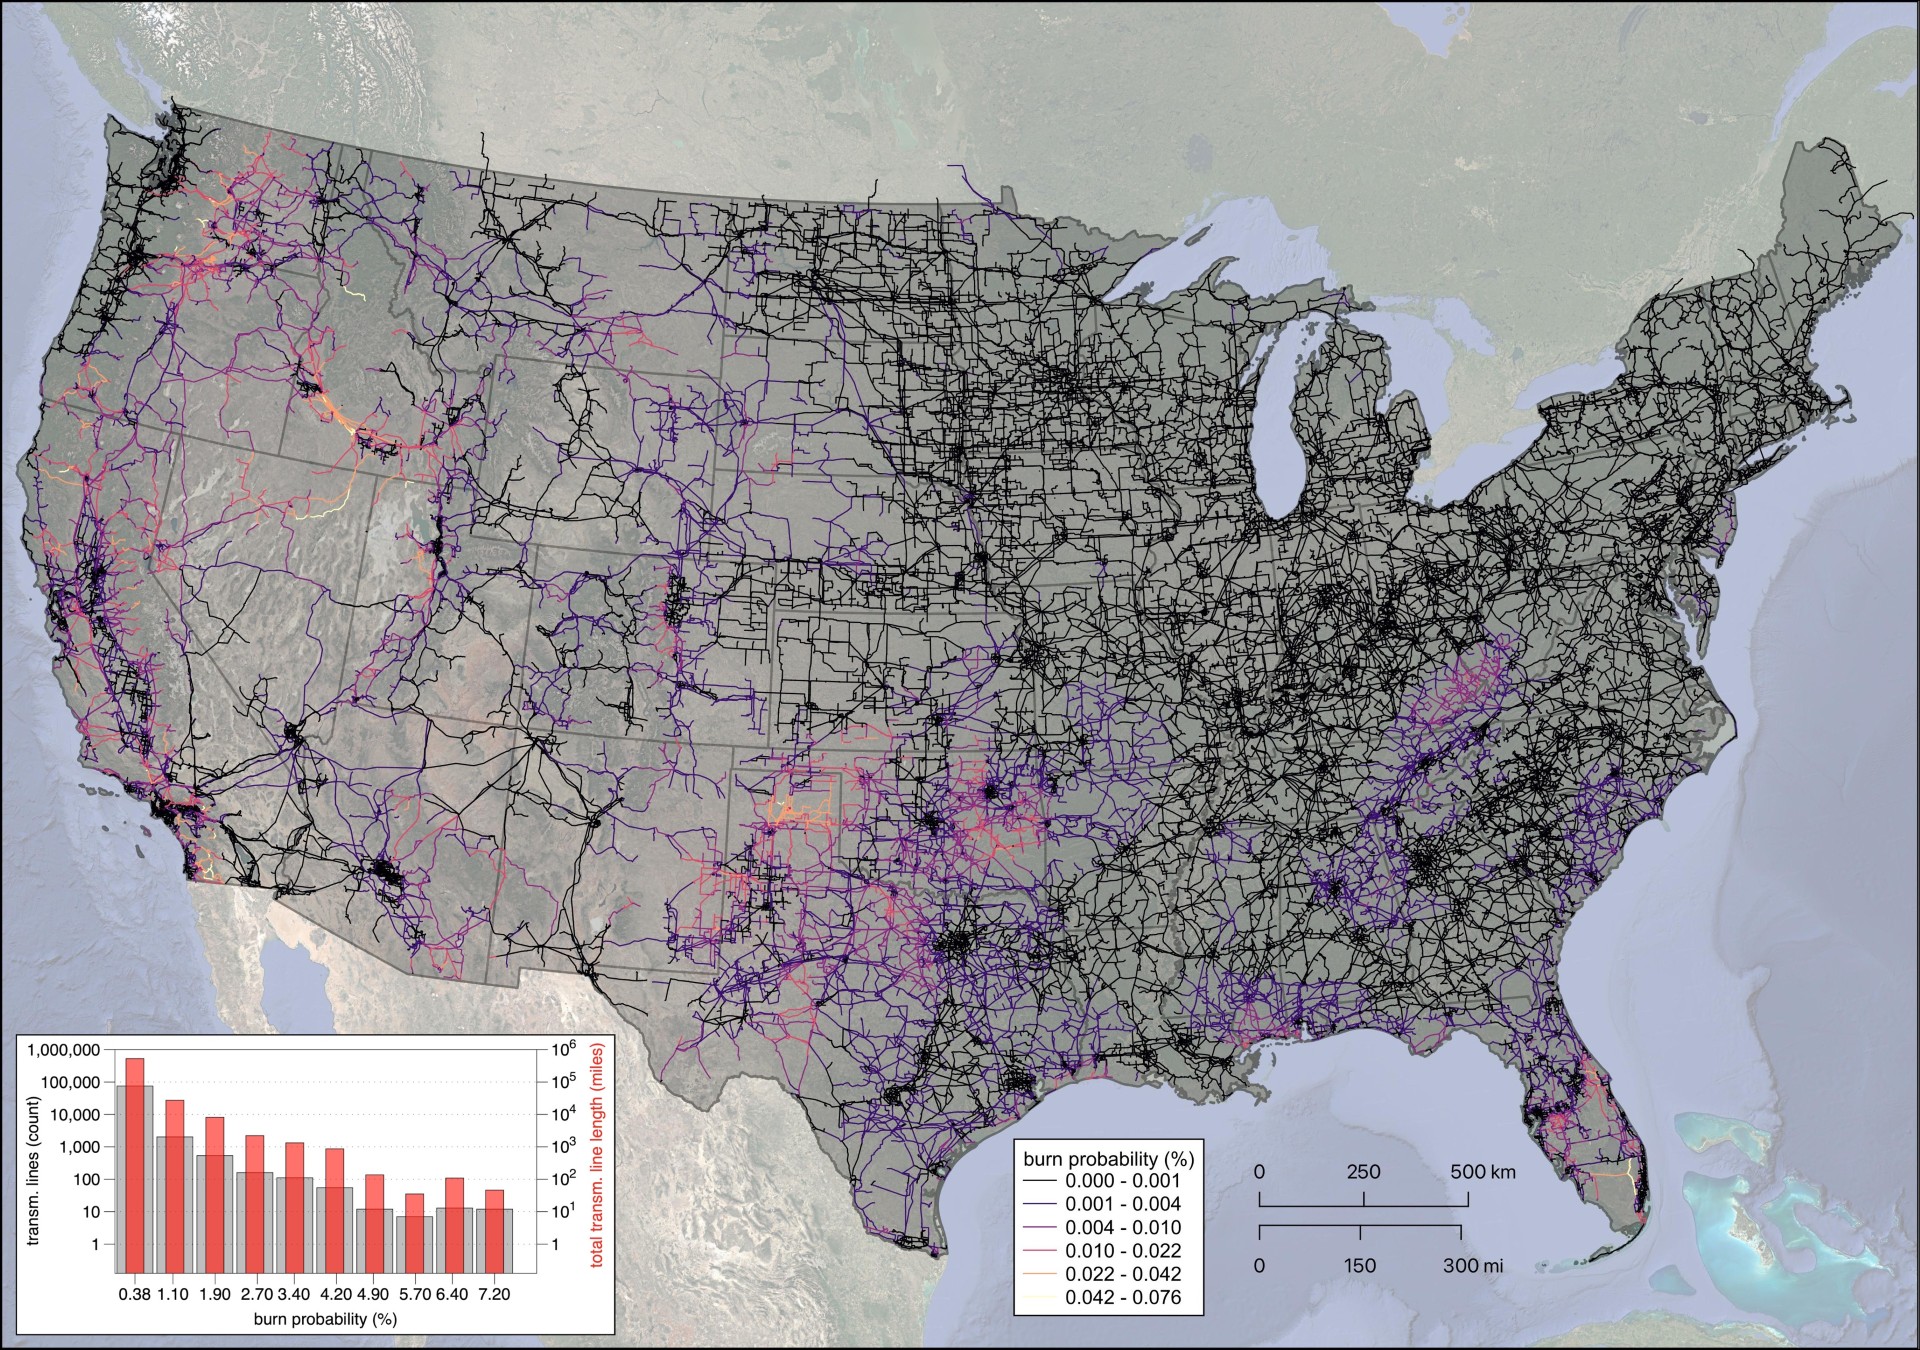
This map shows the average burn probability along each transmission line in the U.S. The inset histogram highlights the non-linear distribution of these burn probabilities, requiring the logarithmic y-axes – burn probability of most lines in 2024 are very low, but is high for a few select lines.