Mapping Social Vulnerability of Transmission Corridors in the United States
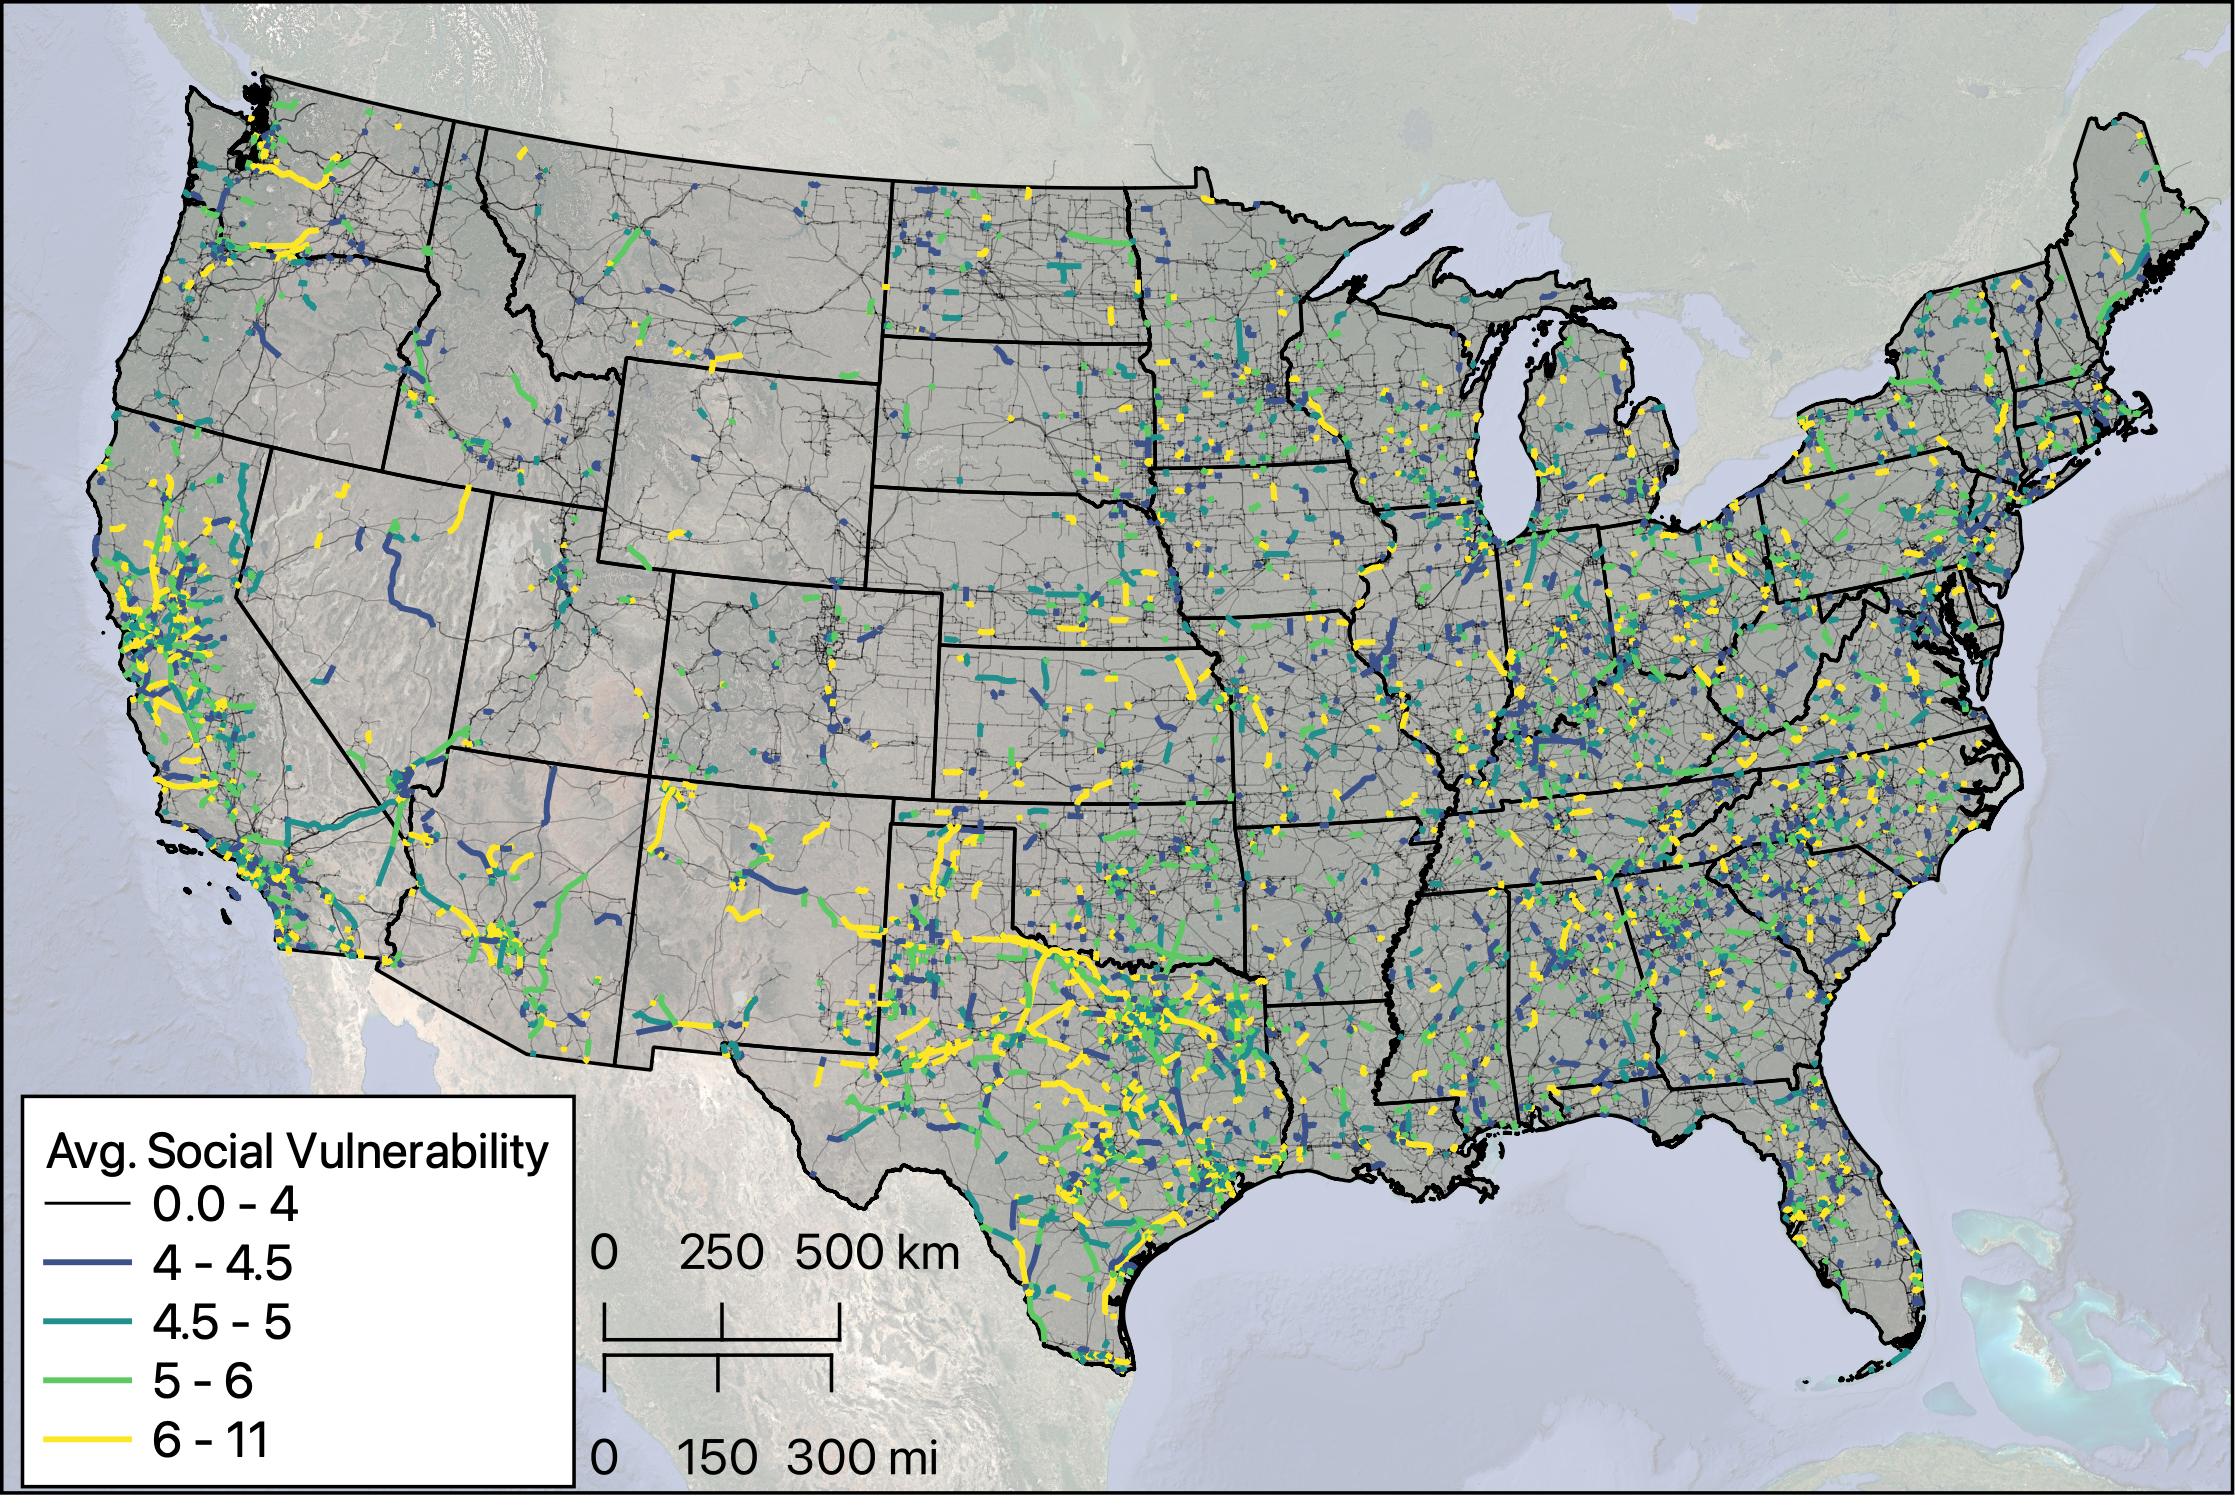
This map shows the transmission line's average CDC's Social Vulnerability Index (SVI), calculated by intersecting each transmission line with the SVI of each U.S. Census tract and deriving a length average. The SVI estimates a location's vulnerability to disruption during a hazardous event, such as a hurricane or disease outbreak. SVI is based on four individual metrics: Socioeconomic Status, Housing Type and Transportation, Household Characteristics, and Racial and Minority Status. Here we are using the 2024 SVI data release (which uses 2022 population statistics) at the U.S. Census tract scale. Additional documentation and direct data download are available here.
These transmission lines intersect with vulnerable cities and municipalities, but they themselves do not inherently cause vulnerability. By understanding the intersection of transmission lines with these places, local governments, NGOs, transmission operators, and others can leverage these corridors to expand access to various benefits such as improved infrastructure, increased economic opportunities, enhanced social services, and more.
PNNL-SA-210071