Model Output

Once a model run is complete, APGEMS will automatically generate and display initial model graphics. Output products include Cumulative Exposure and Time-Averaged Concentration. If the radionuclides are involved in the release, plots of Total Effective Dose Equivalent and Maximum Organ Dose are also generated. In the Exercise Generate mode, a variety of additional model output products are generated to provide readings for a range of radiological monitoring instruments (e.g., MicroRem meter, Grab Air Sample - Alpha).
The user can view an animated display that shows the time evolution of impacts. Alternatively, the user can select specific time periods for viewing. The user can zoom out to examine impacts over wide areas or zoom in to see results at small distance scales. The user can also hide the main menu options to provide a larger display of the output graphics.

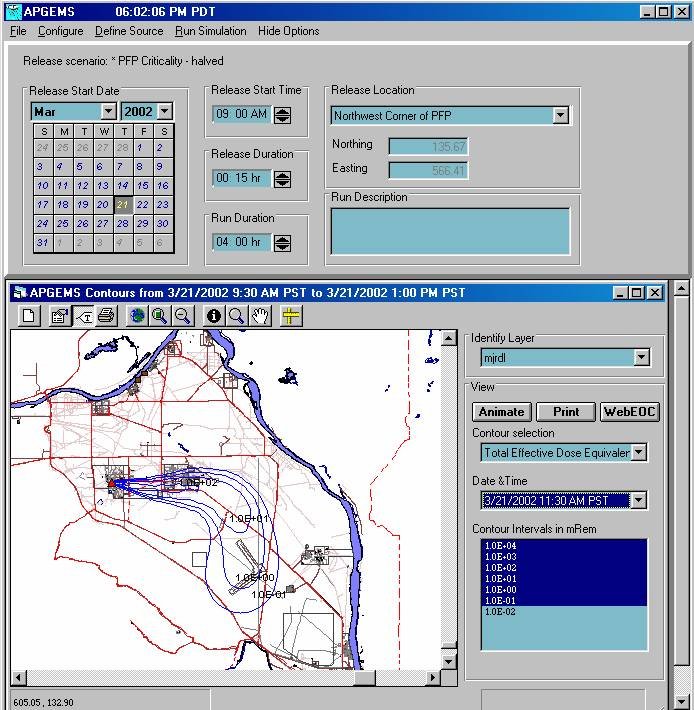
The model projection of Total Effective Dose Equivalent (TEDE) is displayed for a release from the PFP facility. Contour values are labeled in units of mRem. Results are displayed at 2.5 hours after the beginning of the release. Both the spatial and temporal variation in the wind field is reflected in this plot. Contaminant transport was initially toward the east before shifting toward the south.

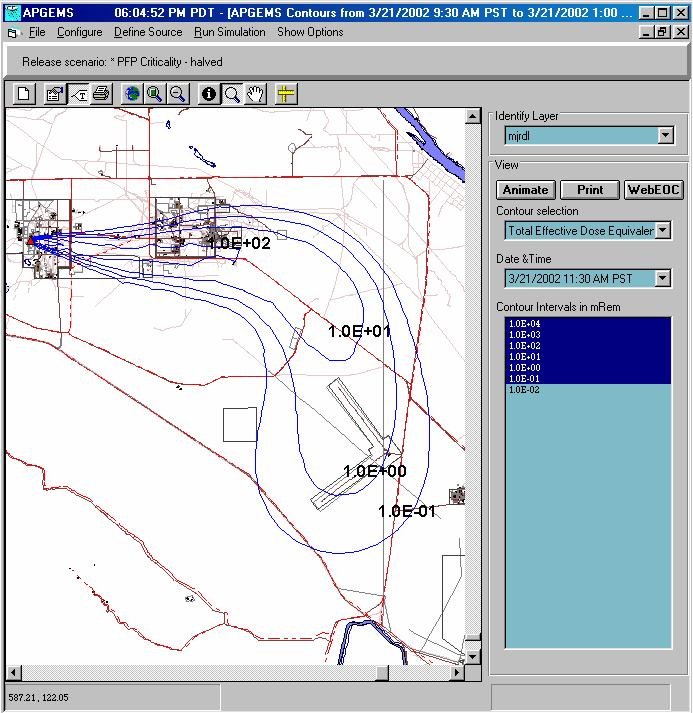
A zoomed-in view of the plot of TEDE. In this display, the main menu options are hidden to enhance the presentation of the output plot.

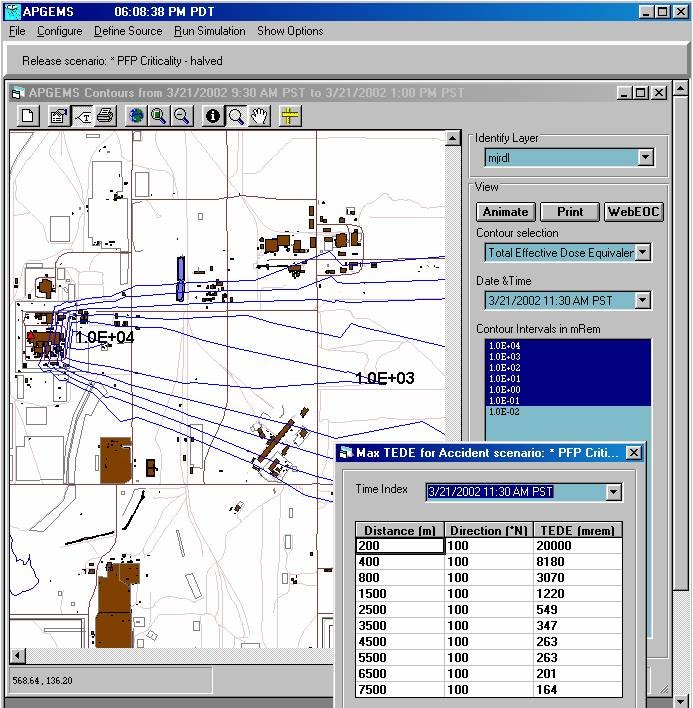
A display of TEDE values in the area immediately downwind of the release location. Also displayed is a numerical listing of centerline TEDE values at key distances downwind.