Water Quality Framework
The SSM framework was designed to simulate the influence of nutrients and carbon on biogeochemical oceanographic processes such as phytoplankton primary productivity and dissolved oxygen (DO) concentrations.
FVCOM Linkage ? Nutrient Loads ? Ocean Boundary Conditions ? Sediment Diagenesis & Hypoxia ? pH & Ocean Acidification ? Water Quality Validation
The Salish Sea Model (SSM) water quality computational framework was designed to simulate the influence of nutrients and carbon on biogeochemical oceanographic processes such as phytoplankton primary productivity and dissolved oxygen (DO) concentrations. PNNL and Washington State Department of Ecology in consultation with a Model Technical Advisory Committee of experts selected the CE-QUAL-ICM model, a state-of-the-art biogeochemical code developed by the U.S. Army Corps of Engineers (Cerco and Cole 1995) for coupling to the Finite Volume Coastal Ocean Model (FVCOM). It is capable of simulating 32 state variables, including multiple algae, carbon, multiple zooplankton, phosphorus, nitrogen, silica, and DO. Aquatic vegetation, benthic deposit feeders, and a predictive sub-model to calculate the interactive fluxes of DO and nutrients between the sediment and the water columns are also available. The use of the carbon cycle as the basis for eutrophication calculations, the ability to include sediment diagenesis, and the use of a finite volume approach were important considerations in selecting of the CE-QUAL-ICM model for the SSM domain. The rationale for selecting the FVCOM model for hydrodynamics and CE-QUAL-ICM kinetics for water quality for the SSM domain is described in the Model Selection Recommendations technical memorandum (Khangaonkar and Kim 2009) and the project quality assurance plan (Sackmann 2009). Kinetics simulated by the model are described in detail by Cerco and Cole (1995) and are schematically represented in the diagrams below.
Note that sediment diagenesis and pH modules were added subsequently (Pelletier et. al. 2017a, Pelltier et al. 2017b, Bianucci et al. 2018) and are also described at the Sediment Diagensis and pH pages. The biogeochemical model of the Salish Sea is described under Water Quality Validation and in Khangaonkar et al. (2018).
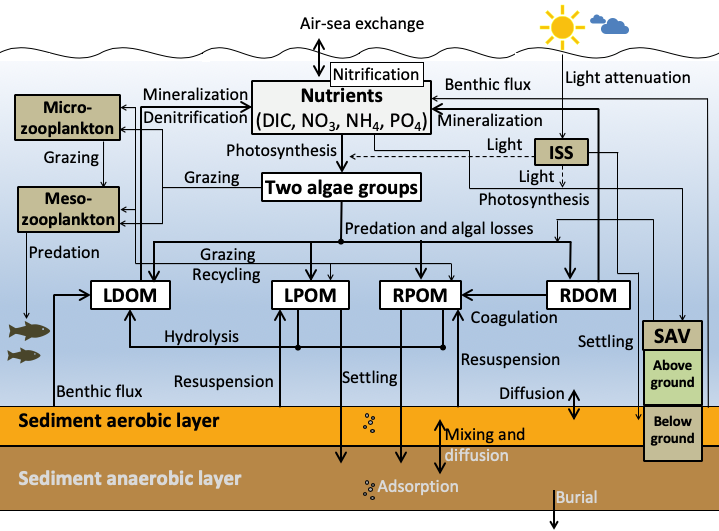
The SSM water-quality component currently set up to simulate the following 21 state variables:
- Algae Species 1 – diatom
- Algae Species 2 – dinoflagellates
- Dissolved organic carbon (DOC) – labile
- DOC – refractory
- Particulate organic carbon (POC) – labile
- POC – refractory
- Ammonium (NH4)
- Nitrate+Nitrite (NO3+NO2)
- Dissolved organic nitrogen (DON) – labile
- DON – refractory
- Particulate organic nitrogen (PON) – labile
- PON – refractory
- Phosphate (PO4)
- Dissolved organic phosphorus (DOP) – labile
- DOP – refractory
- Particulate organic phosphate (POP) – labile
- POP – refractory
- Particulate inorganic phosphate
- Dissolved oxygen.
- Dissolved Inorganic Carbon (DIC)
- Total Alkalinity
FVCOM (Hydrodynamics) Linkage to CE-QUAL-ICM (Water Quality)
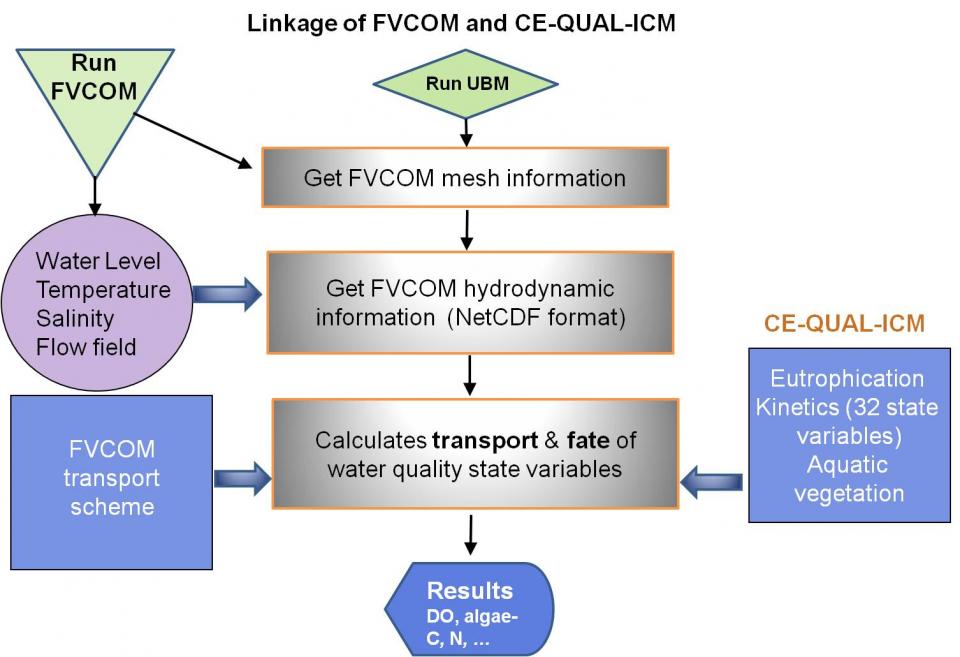
Linkage of the Finite Volume Coastal Ocean Model (FVCOM) hydrodynamics with the CE-QUAL-ICM kinetics was accomplished by developing a modified code, herein referred to as the Unstructured Biological Model (UBM) or simply FVCOM-ICM. In this code, the transport calculations are conducted through the FVCOM framework and biogeochemical calculations are conducted using CE-QUAL-ICM kinetics over the same finite volume mesh used in hydrodynamic calculations using triangular elements. The scalar quantities, such as water-surface elevation, temperature, salinity, and the water-quality state variable concentrations, are computed at the cell nodes, and vector quantities, such as lateral velocities, are computed at the cell centroid.
When FVCOM-ICM is executed, it reads in all of the FVCOM information including computed solution and uses it to conduct transport and biogeochemical calculations. The FVCOM mesh information is read first, followed by the hydrodynamic information, including velocity, diffusivities, open-boundary fluxes, and water levels. Scalars computed in the hydrodynamic step required for the biogeochemical computations, including salinity and temperature, are also read into FVCOM-ICM. The model then reads in the initial conditions for the model domain and the external loads from the open boundaries, river boundaries, and point and nonpoint sources of nutrients. This information includes loadings for each of the 19 biogeochemical model state variables as either masses or fluxes. Once these data are read in to the model, biogeochemical calculations are conducted. A schematic flow diagram of the FVCOM-ICM model is provided below. The technical details describing the development of the offline coupling of FVCOM and CE-QUAL-ICM are provided in detail by Kim and Khangaonkar (2012).
Nutrient Loads to the Salish Sea (Puget Sound and Georgia Basin) - Rivers, Outfalls, and Ocean Boundaries
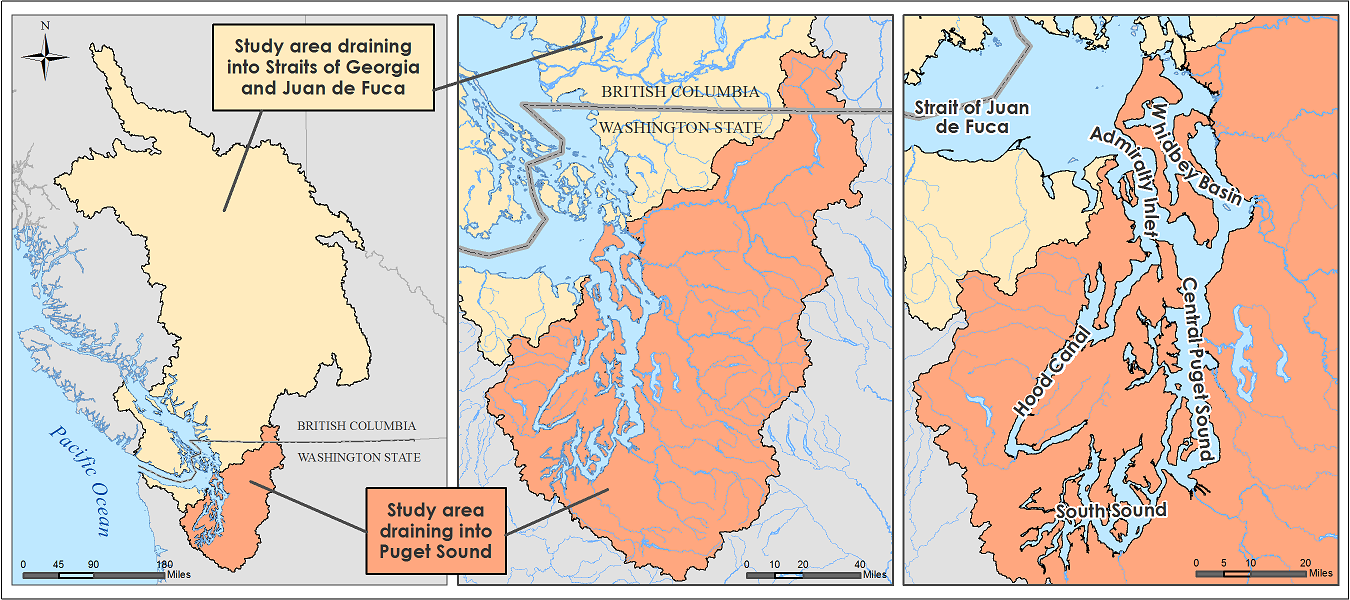
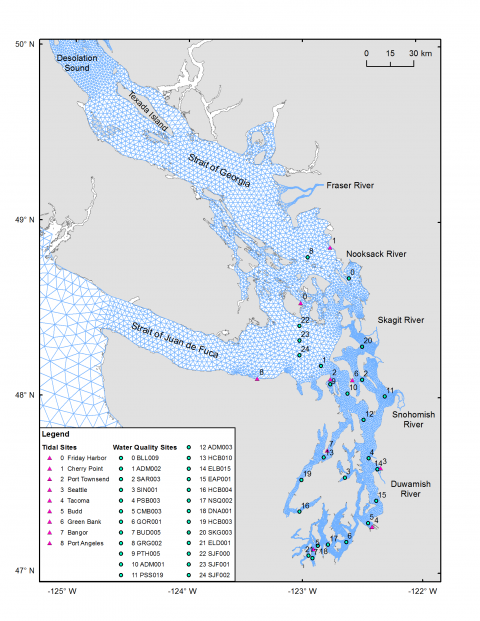
Nutrient measurements from a variety of sources were used to develop watershed-loading estimates for the 64 watersheds of interest shown in the figure below. Hydrologic analysis used to develop the associated stream flows is provided in Hydrodynamics/Freshwater Inflow and by Mohamedali et al. (2011). The primary source of the data was measurements conducted as part of the Washington State Department of Ecology's South Puget Sound Dissolved Oxygen (DO) study, which monitored 33 rivers between 2006 and 2007 (Roberts et al. 2008). Multiple linear regression was used to predict daily nutrient concentrations for the rivers and streams from more coarsely sampled (e.g., monthly) data sets.
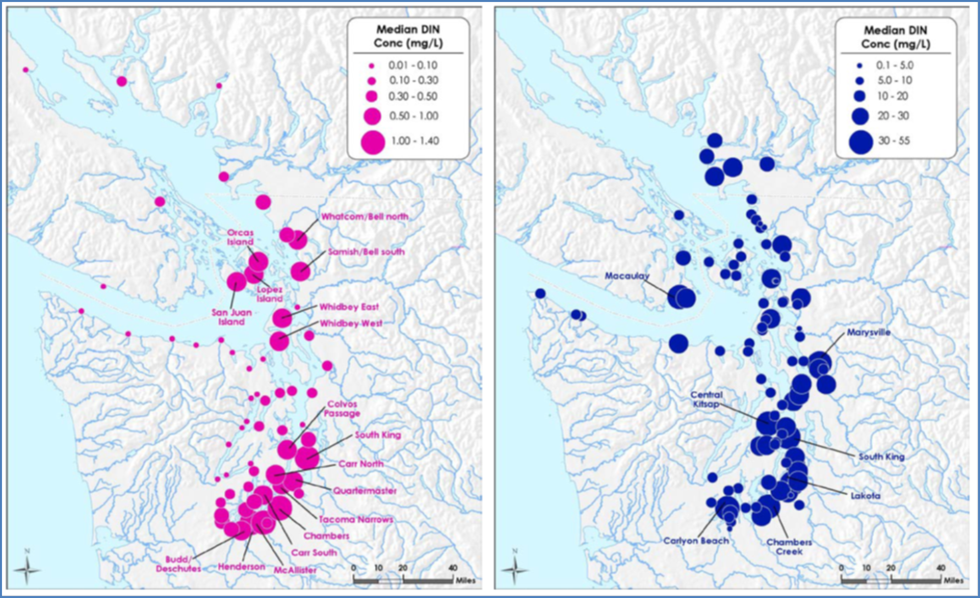
A total of 99 municipal wastewater treatment plants (WWTPs) or industrial facilities, 23 major rivers, and 116 watershed streams discharge to the model domain, either directly into the marine waters of Puget Sound or into rivers downstream of monitoring locations. This includes 78 U.S. municipal WWTPs, 9 Canadian municipal WWTPs, 5 oil refineries, 4 active pulp/paper mills, and 1 aluminum facility within the Puget Sound study area. Of all the forms of nitrogen, dissolved inorganic nitrogen (DIN; sum of nitrate+nitrite and ammonium) is of greatest interest because this form of nitrogen often limits the growth of marine algae. The figure below is an example of loads distributed around the Salish Sea domain that were computed using this technique. Median DIN concentrations in rivers and WWTPs discharging directly into the Salish Sea between 1999 and 2008 are shown.
Ocean Boundary Conditions
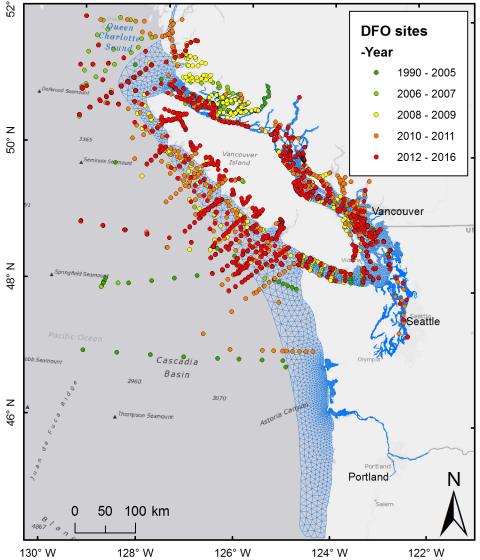
Since the 1950s, researchers have pointed out the importance of the process by which water trapped behind the sills in fjords such as Puget Sound is replaced by water of greater density that flows in over the sills. This inflow in the summer months is fed by coastal upwelling, which supplies most of the macronutrients available for production. For Year 2014 calibration using the current version of the model with expanded grid, the ocean boundary values at the edge of the continental shelf for nutrients, DO, and algal biomass were derived from quarterly monitoring data collected from various locations over the continental shelf by the Department of Fish and Oceans, Canada (DFO) and interpolated to the model ocean boundary in time and space (Khangaonkar et al. 2018).

Sediment Diagenesis Module and Hypoxia
Background
Low concentrations of DO have been measured throughout the Salish Sea and are at hypoxic levels (< 2 mg/L) in selected sub-basins. Recent modeling investigations using the prior version of the Salish Sea Model (e.g. Khangaonkar et al. 2012, Roberts et. al. 2014) showed that that low concentrations occur throughout much of the Salish Sea due to the intrusion of water with naturally occurring low DO from the Pacific Ocean. However, some regions of Puget Sound are also significantly influenced by human nutrient contributions. In those investigations, sediment water interaction was prescribed as being uniform fluxes of nutrients and DO. The model worked reasonably well in most sub-basins but could not achieve domain-wide calibration for near-bed LOW DO levels. With prescribed uniform sediment fluxes, hypoxia in regions such as Lynch Cove region of Hood Canal could not be reproduced satisfactorily.
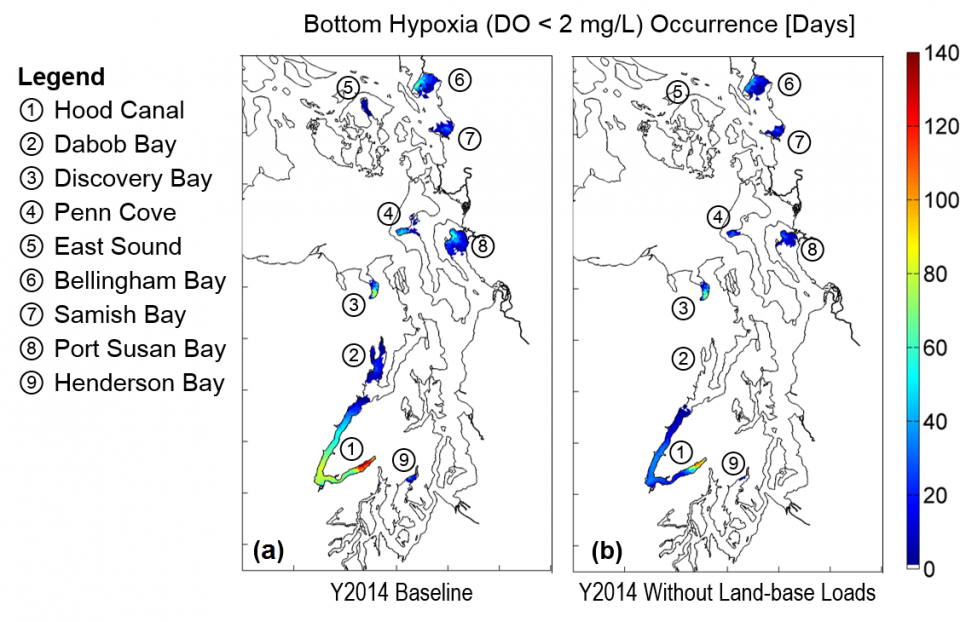
The new version of the Salish Sea Model (Khangaonkar et al. 2018) includes a sediment diagenesis module which allows direct coupled interaction between the water column and sediments through the processes of organic sediment settling, burial, and remineralization. The sediment module generates nutrient fluxes including sediment oxygen demand. With the help of this improvement, the large region of hypoxia in Hood Canal that extends over 30-40 km during its peak has been reproduced as shown in the Figure below. The model also correctly represents hypoxia in Penn Cove and East Sound-waterbodies previously identified as potential areas of concern based on monitoring data. Other areas of concern identified through model results include the Henderson Bay in South Puget Sound and Port Susan Bay.
Module Formulation and Theory
Sediment diagenesis theory is described in detail in Pelletier et al. (2017a) and Bianucci et al. (2018) and is briefly summarized here. Sediment diagenesis is the process where biogeochemical processes transform the nutrients delivered to the sediments from particles settling from the water column and release a portion of the nutrients back into the water column. The process also consumes oxygen. A portion of the nutrients are buried as well, where they are permanently lost from the active system (see schematic below).
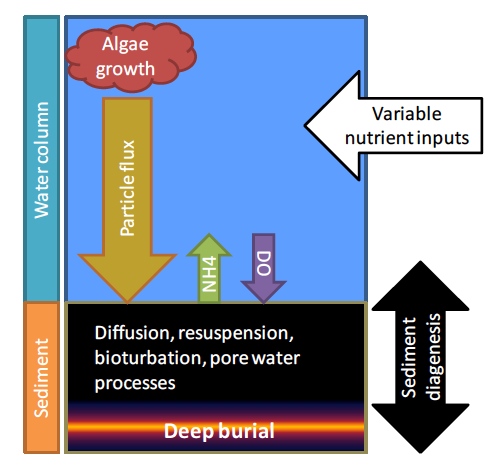
As the algae bloom, they transform dissolved material into particulate matter. As the algae die, a fraction settles to the bottom. Zooplankton that feed on the algae also produce wastes that settle to the bottom as a flux of particles. These combined fluxes fuel processes within the sediments. A variety of physical and biogeochemical processes act on the organic matter in the sediments. Microbes decompose the organic matter in the sediment which consumes oxygen. Plants and animals physically rework the sediments in a process known as bioturbation. Decomposition and oxidation of organic matter transforms nutrients and release them back to the water column. Sediment oxygen levels decline from bottom water concentrations to near zero within a few millimeters to centimeters of the water surface, which produces strong gradients. These gradients contribute to diffusion into the sediments as oxygen is used to fuel decomposition of organic matter. This exerts a sediment oxygen demand (SOD) on the water column. The decomposition of organic nitrogen generates ammonium and also creates a gradient that pushes ammonium out of the sediments and into the water column.
The Sediment Diagenesis Module in the Salish Sea Model code (FVCOM-ICM) is an implementation based on the Di Toro et al. (2001) model of sediment oxygen demand in the ICM framework. The model was cross checked using bench mark tests with the well-documented WASP modeling framework developed by EPA (Martin and Wool 2013) shown in the process diagram below, also based on the same Di Toro et. al. (2001) formulation.
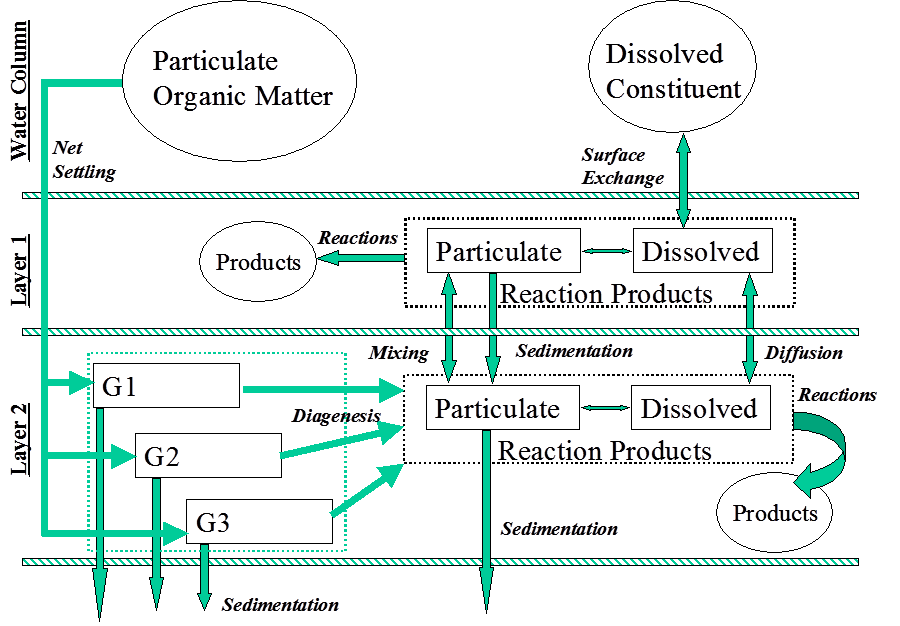
The Sediment Diagenesis Module numerically integrates the mass balance equations for chemical constituents in two layers of sediment. Layer 1: A relatively thin aerobic layer at the sediment water interface with variable thickness that is dynamically calculated. Layer 2: A thicker anaerobic layer with thickness equal to the total sediment depth of 10 minus the depth of the aerobic layer. Particulate organic matter (POM) initially decomposes rapidly in the sediments, but then slows down as the more labile fraction is consumed. In order to capture this process, the settled POM is fractioned to one of three "G classes" based on overall reactivity. The three G classes represent a relatively rapidly decomposing labile class (G1), a more refractory form (G2), and a relatively inert form (G3). The decomposition of the three G classes of POM occurs in layer 2.
References
1. Di Toro, D.M. 2001. Sediment Flux Modeling, Wiley-Interscience, New York, New York. 624 pp. ISBN: 978-0-471-13535-7.
2. Martin, J.L. and T.A. Wool. 2013. Supplement to Water Analysis Simulation Program User Documentation. WASP Sediment diagenesis Routines: Model Theory and Users Guide. U.S. Environmental Protection Agency, Region 4, Atlanta GA.
pH and Ocean Acidification
The Blue-Ribbon Panel of scientists, tribes, and shellfish managers appointed by former Governor Christine Gregoire recommended future research, monitoring, and actions to understand, prevent or mitigate, and adapt to the acidification of Washington State marine waters. The panel recommended efforts to quantify how much regional human sources (water nutrients and air emissions) exacerbate the effects of the upwelled Pacific Ocean water and global atmospheric CO2 on the acidification of marine waters. PNNL and Ecology have developed a planning document (Long et al. 2014) that summarizes the initial approach recommended to simulate the impacts of regional human sources on acidification. The effort is based on a strong belief that it may be possible to manage nutrient pollution and modify our fisheries and water-quality management practices to minimize potential impacts from ocean acidification. Monitoring and modeling can help forecast conditions and adapt our activities to minimize the adverse effects.
Model Formulation
Biogeochemical processes such as algal growth and die-off affect total inorganic carbon in the water column and therefore affect pH. We know that shallow sub-basins in Puget Sound and Georgia Basin regions of Salish Sea are highly productive, which results in almost complete depletion of nutrients during the spring and summer algae blooms. Discharge of nutrient pollutants into the Salish Sea during these periods could lead to eutrophic conditions. High levels of algae during the daytime lead to super-saturated dissolved oxygen (DO) levels. The same algae during the nighttime produce copious amounts of carbon dioxide (CO2) through respiration resulting in reduced pH. At the conclusion of the spring and summer blooms, algae die, decay, and settle to sediments, leading to conditions suitable for hypoxia. The decaying algae also release large amounts of inorganic carbon back to the water column. Data from sub-basins of Puget Sound show sharp drops in pH correlated to nighttime respiration. This problem is exacerbated by ocean acidification and upwelling.
Carbonate chemistry and pH model as incorporated in the Salish Sea Model is described in detail in Pelletier et al. (2017b) and Bianucci et al. (2018) and is briefly summarized here.
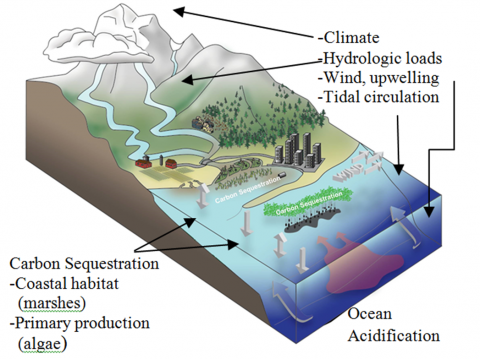
The existing model of the Salish Sea, conducts carbon-based biogeochemical simulations and is well suited for incorporating acidification kinetics. The approach selected by the project team was to modify the existing FVCOM-ICM model to include relevant new quantities in the computational domain. Specifically, total dissolved inorganic carbon (TDIC) and total alkalinity (TA) were included as state variables in advection, transport, and turbulent mixing computations. Aragonite saturation and pH are secondary quantities computed based on predicted values of TDIC and TA. The parameters of the CO2 system, pH, and calcium solubility are computed based any two of the four measurable parameters (TA, TDIC, pH, and fCO2 or pCO2) using the CO2SYS framework of Lewis and Wallace (1998).
TA in the water column increases due to processes that produce NH4 or consume NO3, while consumption of NH4 and production of NO3 decreases TA. Therefore, TA in the model increases due to new primary production, remineralization of LDON and RDON, water column denitrification, and sediment fluxes of NH4; it decreases due to regenerated primary production, water column nitrification, and sediment fluxes of NO3. The processes that consume DIC are primary production and water column nitrification. Production of DIC occurs through remineralization of LDOC and RDOC, water column denitrification, phytoplankton losses by predation, basal metabolism and photorespiration, and sediment fluxes. The model also includes air-sea exchange of CO2, which can either increase or decrease DIC depending on whether the surface partial pressure of CO2 (pCO2) is lower or higher than the atmospheric pCO2.
Simulation of Carbonate Chemistry and pH in Salish Sea
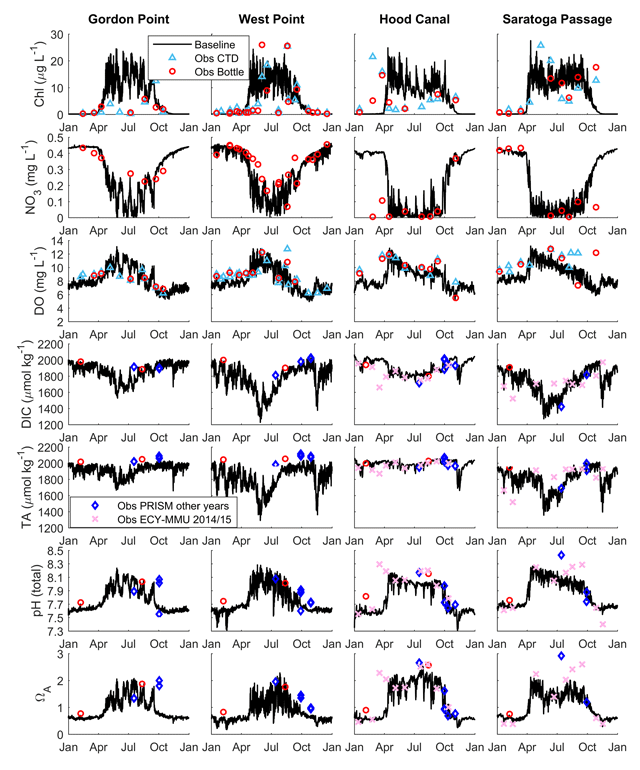
Time series of surface model values (black lines) for seven variables (rows) and four stations (columns). Overlapped observations belong to CTD casts (blue triangles) and bottles (red circles) for 2008; diamonds and crosses correspond to other years in the panels for DIC (µmol kg–1), TA (µmol kg–1), pH (total scale), and OA (blue diamonds for PRISM, pink crosses for ECY-MMUdata). (Bianucci et al. 2018).
Lewis, E. and D. Wallace. 1998. Program Developed for CO2 System Calculations, Oakland Ridge National Laboratory, Technical report # ORNL/CDLAC-105.
Water-Quality Model Validation and Error Analysis
Using year 2006 as the baseline and as part of the original model development and testing, many model runs were conducted to identify the parameters that most strongly affected predicted nutrients, algal biomass (chlorophyll a), and dissolved oxygen (DO) concentrations. The parameters were then adjusted using professional judgment until predicted results best reproduced observed DO, nutrient, and chlorophyll a data. The model results were most sensitive to the maximum photosynthetic rate for algae (Pmax), carbon to chlorophyll ratios, grazing loss rate, reaeration parameterizations, settling rates, and half saturation constants of nutrient uptake. Model calibration was further improved through comparison with data from a larger set including all available monitoring stations in the Puget Sound Georgia Basin that are maintained by the Washington State Department of Ecology's (Ecology's) Marine Monitoring Program. Ecology has conducted monitoring of Puget Sound since the 1970s and continues to do so using a combination of seaplanes, ferries, and moored instruments. The model setup and calibration effort using 2006 data as the baseline was previously summarized by Khangaonkar et al. (2012).
Since then the Salish Sea Model has undergone several improvements such as expansion of the model domain, and addition of new capabilities. The model validation (or re-calibration) was recently completed using data from Year 2014 and is described in Khangaonkar et al. (2018). The model now includes fluxes of nutrients and sediment oxygen demand from sediment diagenesis processes. The model also includes a carbonate chemistry and pH module. While most parameter values are unchanged from those previously presented by Khangaonkar et al. (2012), key changes during recalibration included adjustments of algal and POM settling velocities, reaeration formulation, and the total and net sedimentation rates associated with the sediment diagenesis model. Parameter values for sediment diagenesis processes were set to default values recommended by Di Toro (2001) and Testa et al. (2013). The most significant iterative adjustment was related to net settling rates of suspended organic sediments in the bottom layer of the water column. A settling rate of 5 m/d was used for labile and refractory POM (WSSLAB and WSSREF, respectively), which ensured that, on average, POM reached the bottom layer of the water column within a short period of less than 2 weeks.
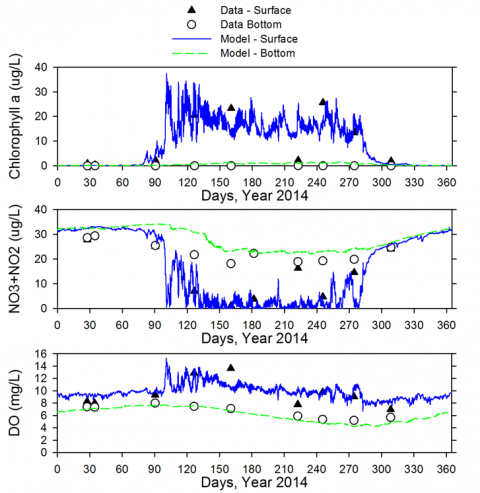
Time series at a representative Puget Sound station (EAP003, near Vashon Island) serves as an example to compare simulated surface and bottom layer concentrations of chlorophyll a, DO, and nitrate, with monthly monitoring data. The upper layer in the Salish Sea Model occupies 3% of the water column and is representative of the outflow plume of brackish water from the Puget Sound region of the Salish Sea. The bottom layer, which occupies the lower 15% of the water column in the Salish Sea Model, is representative of incoming nutrients and DO.
Time series of model results and observed data - chlorophyll a, nitrate, and DO
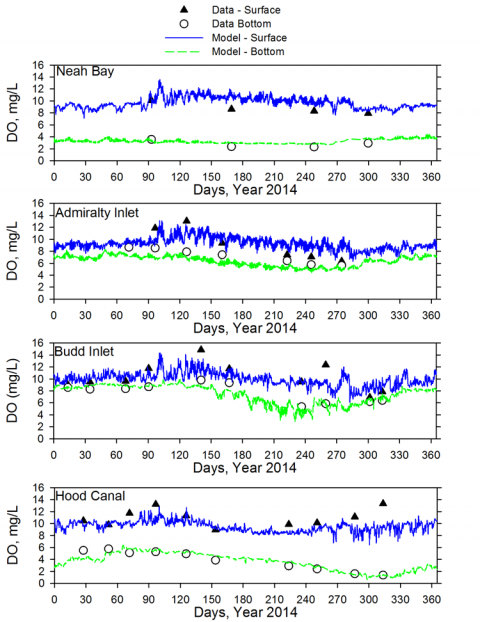
Progression of DO concentrations from the Strait of Juan de Fuca (Neah Bay station) to Puget Sound
Salish Sea Model overall error statistics and skill score for major constituents - Year 2014
|
Standard Y2014 Validation Typical simulation using inputs derived from 2014 data |
|||
|---|---|---|---|
| ME | RMSE | WSS | |
| T (?) | -0.27 | 0.76 | 0.96 |
| S (ppt) | -0.12 | 0.97 | 0.84 |
| DO (mg/L) | -0.07 | 0.92 | 0.92 |
| Nitrate: NO3+NO2 (µ mol/L) | -0.22 | 6.02 | 0.91 |
| Chlorophyll a (µg /L) | 0.60 | 4.32 | 0.70 |
| Ammonium: NH4 (µ mol/L) | 0.27 | 1.16 | 0.67 |
| Phosphate: PO4 (µ mol/L) | -0.36 | 0.68 | 0.69 |
| pH |
0.02 -0.03a |
0.16 0.14a |
0.67 0.81a |
| TA (µ mol/kg) | 39.8a | 86.4a | 0.74a |
| DIC (µ mol/kg) | 49.7a | 102.5a | 0.80a |
|
ME = Mean error (bias) AME = Absolute mean error RMSE = Root-mean-square error WSS = Willmott (1982) Skill Score a for carbonate chemistry variables including TA, DIC, and pH, additional data collected by two UW - Puget Sound Regional Synthesis Model (PRISM) cruises in two different months (February and August), covering all of Puget Sound and the Strait of Juan de Fuca was used. Separate skill numbers are provided for pH to distinguish between the two data sets collected and analyzed using different techniques. |
|||
- Di Toro, D. 2001. Sediment Flux Modeling. Wiley Interscience. John Wiley & Sons, Inc.
- Testa, J, D Brady, D Di Toro, W Boynton, J Cornwell, and W Kemp. 2013. Sediment flux modeling: simulating nitrogen, phosphorus, and silica cycles, Estuarine, Coastal, and Shelf Science, 131: 245-263. doi: 10.1016/j.ecss.2013.06.014