
PNNL

  • About
  • News & Media
  • Careers
  • Events
  • Research
    • Scientific Discovery
      • Biology
        • Chemical Biology
        • Computational Biology
        • Ecosystem Science
        • Human Health
          • Cancer Biology
          • Exposure Science & Pathogen Biology
          • Metabolic Inflammatory Diseases
        • Integrative Omics
          • Advanced Metabolomics
          • Chemical Biology
          • Mass Spectrometry-Based Measurement Technologies
          • Spatial and Single-Cell Proteomics
          • Structural Biology
        • Microbiome Science
          • Biofuels & Bioproducts
          • Human Microbiome
          • Soil Microbiome
          • Synthetic Biology
      • Chemistry
        • Computational Chemistry
        • Chemical Separations
        • Chemical Physics
        • Catalysis
      • Earth & Coastal Sciences
        • Atmospheric Science
          • Atmospheric Aerosols
          • Human-Earth System Interactions
          • Modeling Earth Systems
        • Coastal Science
        • Ecosystem Science
        • Plant Science
        • Subsurface Science
        • Terrestrial Aquatics
      • Materials Sciences
        • Materials in Extreme Environments
        • Precision Materials by Design
        • Science of Interfaces
        • Solid Phase Processing
          • Cold Spray
          • Friction Stir Welding & Processing
          • ShAPE
      • Nuclear & Particle Physics
        • Dark Matter
        • Flavor Physics
        • Fusion Energy Science
        • Neutrino Physics
      • Quantum Information Sciences
    • Sustainable Energy
      • Electric Grid Modernization
        • Emergency Response
        • Grid Analytics
          • AGM Program
          • Tools and Capabilities
        • Grid Architecture
        • Grid Cybersecurity
        • Grid Energy Storage
        • Grid Resilience and Decarbonization
          • Earth System Modeling
          • Energy System Modeling
        • Transmission
        • Distribution
      • Energy Efficiency
        • Appliance and Equipment Standards
        • Building Energy Codes
        • Building Technologies
          • Advanced Building Controls
          • Advanced Lighting
          • Building-Grid Integration
        • Building and Grid Modeling
        • Commercial Buildings
        • Federal Buildings
          • Federal Performance Optimization
          • Resilience and Security
        • Grid Resilience and Decarbonization
        • Residential Buildings
          • Building America Solution Center
          • Energy Efficient Technology Integration
          • Home Energy Score
        • Energy Efficient Technology Integration
      • Energy Storage
        • Electrochemical Energy Storage
        • Flexible Loads and Generation
        • Grid Integration, Controls, and Architecture
        • Regulation, Policy, and Valuation
        • Science Supporting Energy Storage
        • Chemical Energy Storage
      • Environmental Management
        • Waste Processing
        • Radiation Measurement
        • Environmental Remediation
      • Fossil Energy
        • Subsurface Energy Systems
        • Carbon Management
          • Carbon Capture
          • Carbon Storage
          • Carbon Utilization
        • Advanced Hydrocarbon Conversion
      • Nuclear Energy
        • Fuel Cycle Research
        • Advanced Reactors
        • Reactor Operations
        • Reactor Licensing
      • Renewable Energy
        • Solar Energy
        • Wind Energy
          • Distributed Wind
          • Wildlife and Wind
          • Wind Data Management
          • Wind Resource Characterization
        • Energy Equity & Health
        • Marine Energy
          • Environmental Monitoring for Marine Energy
          • Marine Biofouling and Corrosion
          • Marine Energy Resource Characterization
          • Testing for Marine Energy
          • The Blue Economy
        • Hydropower
          • Environmental Performance of Hydropower
          • Hydropower Cybersecurity and Digitalization
          • Hydropower and the Electric Grid
          • Materials Science for Hydropower
          • Pumped Storage Hydropower
          • Water + Hydropower Planning
        • Grid Integration of Renewable Energy
        • Geothermal Energy
      • Transportation
        • Bioenergy Technologies
          • Algal Biofuels
          • Aviation Biofuels
          • Waste-to-Energy and Products
        • Hydrogen & Fuel Cells
        • Vehicle Technologies
          • Emission Control
          • Energy-Efficient Mobility Systems
          • Lightweight Materials
          • Vehicle Electrification
          • Vehicle Grid Integration
    • National Security
      • Cybersecurity
        • Discovery and Insight
        • Proactive Defense
        • Trusted Systems
      • Nuclear Material Science
      • Nuclear Nonproliferation
        • Radiological & Nuclear Detection
        • Nuclear Forensics
        • Ultra-Sensitive Nuclear Measurements
        • Nuclear Explosion Monitoring
        • Global Nuclear & Radiological Security
      • Stakeholder Engagement
        • Disaster Recovery
        • Global Collaborations
        • Legislative and Regulatory Analysis
        • Technical Training
      • Systems Integration & Deployment
        • Additive Manufacturing
        • Deployed Technologies
        • Rapid Prototyping
        • Systems Engineering
      • Threat Analysis
        • Advanced Wireless Security
          • 5G Security
          • RF Signal Detection & Exploitation
        • Climate Security
        • Grid Resilience and Decarbonization
        • Internet of Things
        • Maritime Security
      • Chemical & Biothreat Signatures
        • Contraband Detection
        • Pathogen Science & Detection
        • Explosives Detection
        • Threat-Agnostic Biodefense
    • Data Science & Computing
      • Artificial Intelligence
      • Graph and Data Analytics
      • Software Engineering
      • Computational Mathematics & Statistics
      • High-Performance Computing
      • Visual Analytics
    • Lab Objectives
    • Publications & Reports
    • Featured Research
  • People
    • Inventors
    • Diversity & Inclusion
    • Lab Leadership
    • Lab Fellows
    • Staff Accomplishments
  • Partner with PNNL
    • Academia
      • Distinguished Graduate Research Programs
      • Internships
      • Visiting Faculty Program
      • Joint Appointments
      • Joint Institutes
      • Linus Pauling Distinguished Postdoctoral Fellowship
      • Minority-serving Institutions
    • Community
      • Regional Impact
      • STEM Education
        • Resources
        • Student STEM Ambassadors
        • STEM Ambassadors in the Classroom
      • Philanthropy
      • Volunteering
    • Industry
      • Available Technologies
      • Industry
      • Industry Partnerships
      • Licensing & Technology Transfer
      • Entrepreneurial Leave
  • Facilities & Centers
    • All Facilities
      • Atmospheric Radiation Measurement User Facility
      • Electricity Infrastructure Operations Center
      • Energy Sciences Center
      • Environmental Molecular Sciences Laboratory
      • Grid Storage Launchpad
      • Institute for Integrated Catalysis
      • Interdiction Technology and Integration Laboratory
      • PNNL Seattle Research Center
      • PNNL-Sequim
      • Radiochemical Processing Laboratory
      • Shallow Underground Laboratory

Salish Sea Model

  • Model
    • History
    • Hydrodynamics
    • Circulation Maps
    • Water Quality
    • Toxics Fate & Transport
  • Projects
    • Habitat Restoration
    • Water Quality
    • Marine Pollution
    • Oil Spill Transport
    • Sediment Transport
  • News and Publications
  • Data Portal
  • About Us

Breadcrumb

  1. Home
  2. Projects
  3. Salish Sea Model

Hydrodynamics

The Salish Sea Model framework uses an unstructured, triangular grid with resolution to accommodate complex shoreline geometry, waterways, and islands

Model Grid  ♦  Freshwater Inflows  ♦  Tides and Boundary Conditions  ♦  Meteorological Forcing  ♦  Hydrodynamics Validation
Salish Sea Model Domain
SSM model grid with 16,012 nodes and 25,019 triangular elements. The vertical configuration of the model uses 10 sigma-stretched layers distributed using a power law function with an exponent P-Sigma of 1.5, which provides more layer density near the surface.

The Salish Sea Model (SSM) covering the Puget Sound and Georgia Basins was developed using the Finite Volume Coastal Ocean Model (FVCOM) framework (an open source code released by UMASSD-WHOI; Chen et al. 2003). The hydrodynamic component of SSM provides year-long simulations of water-surface elevations, currents, salinity, and temperature, driven by hourly tides, daily freshwater inflows, and meteorological forcing. Tides propagate into the domain from the west through the Strait of Juan De Fuca and move north into Georgia Strait past San Juan Islands and into Puget Sound through Admiralty Inlet. More information about river inflows and meteorological inputs to the model is provided below.

Salish Sea Model Grid

For efficient year-long simulations, we have developed an intermediate-scale version of the entire domain with grid size varying from 100-350 m in estuaries and bays to as large as 800-3000 in the main basins, expanding to 3 km in the Northwest Straits to about 12 km over the continental shelf. It uses an unstructured grid with triangular elements and is well suited to accommodate complex shoreline geometry, waterways, and islands within this domain.

This scale allows sufficient resolution of the various major river estuaries and sub-basins while allowing year-long simulations within 12 hours of run time on a multiprocessor cluster computer (see Khangaonkar et al. 2017a; Khangaonkar et al. 2018). A sigma-stretched coordinate system is used in the vertical plane with 10 terrain-following sigma layers with higher layer-density near the surface. A fine-scale version with cells sides as small as 10 m is also available (see Khangaonkar and Yang 2011; Yang and Khangaonkar 2010).


Freshwater Inflows to the Salish Sea Model

Freshwater discharged to the Salish Sea Model (SSM) consists of flows from 19 major rivers (with permanent U.S. Geological Survey [USGS] gages), streamflow runoff from 45 additional watersheds, and wastewater discharges from 99 municipal and industrial outfalls. Permanent USGS gaging stations capture approximately 69% of the watershed tributary to the main study area. Hydrologic analyses were conducted using past records to estimate streamflow runoff from the remaining watersheds. This included scaling of normalized continuous records from nearby stations by watershed areas and average annual rainfalls. The flow estimates used in the Salish Sea Model were developed by the Washington State Department of Ecology and are described by Mohamedali et al. (2011).

Freshwater Inputs
Source: Mohamedali T, M Roberts, B Sackmann, and A Kolosseus. 2011. Puget Sound Dissolved Oxygen Model Nutrient Load Summary for 1999-2008. Publication No. 11-03-057, Washington State Department of Ecology, Olympia, Washington.
history of freshwater inflows
Time histories of freshwater inflows to Puget Sound in 2006 grouped by their individual basins are plotted. Fraser River inflow time history to Georgia Basin is also plotted for comparison

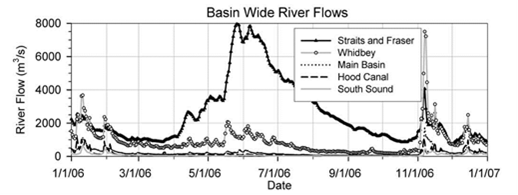
In general, river flows in Puget Sound peak during the high-precipitation winter months of November, December, January, and February. In contrast, the Fraser River inflow on the Canadian side of the domain, which is significantly larger than the rest of the inflows into Puget Sound and the Straits combined, shows a very different seasonal distribution pattern—high flow in the late spring and summer dominated by snowmelt and low flow in the fall and winter. The figure below shows a plot of basin-wide freshwater discharges grouped by their discharge basins. The Whidbey Basin consists of the three largest rivers in Puget Sound (Skagit River, Snohomish River, and Stillaguamish River) and accounts for almost 70% of the total freshwater flow into Puget Sound. Fraser River discharges to the Georgia Basin.

Tides and T/S Boundary Conditions

Tides and boundaries
Water-quality (T/S) monitoring stations from the Department of Fisheries and Oceans (DFO) over the continental shelf, along with SSM boundary.

The Salish Sea Model (SSM) features an expanded open ocean boundary sufficiently far from the estuary entrances at the Strait of Juan de Fuca and Strait of Georgia that extends west to the continental shelf. This has helped overcome the limitation of the early version of the model with ocean boundaries near the estuary entrances.

Tidal forcing at the open boundary is based on tidal constituents (S2, M2, N2, K2, K1, P1, O1, Q1, M4, and M6) derived from the ENPAC model (Spargo et al., 2004).

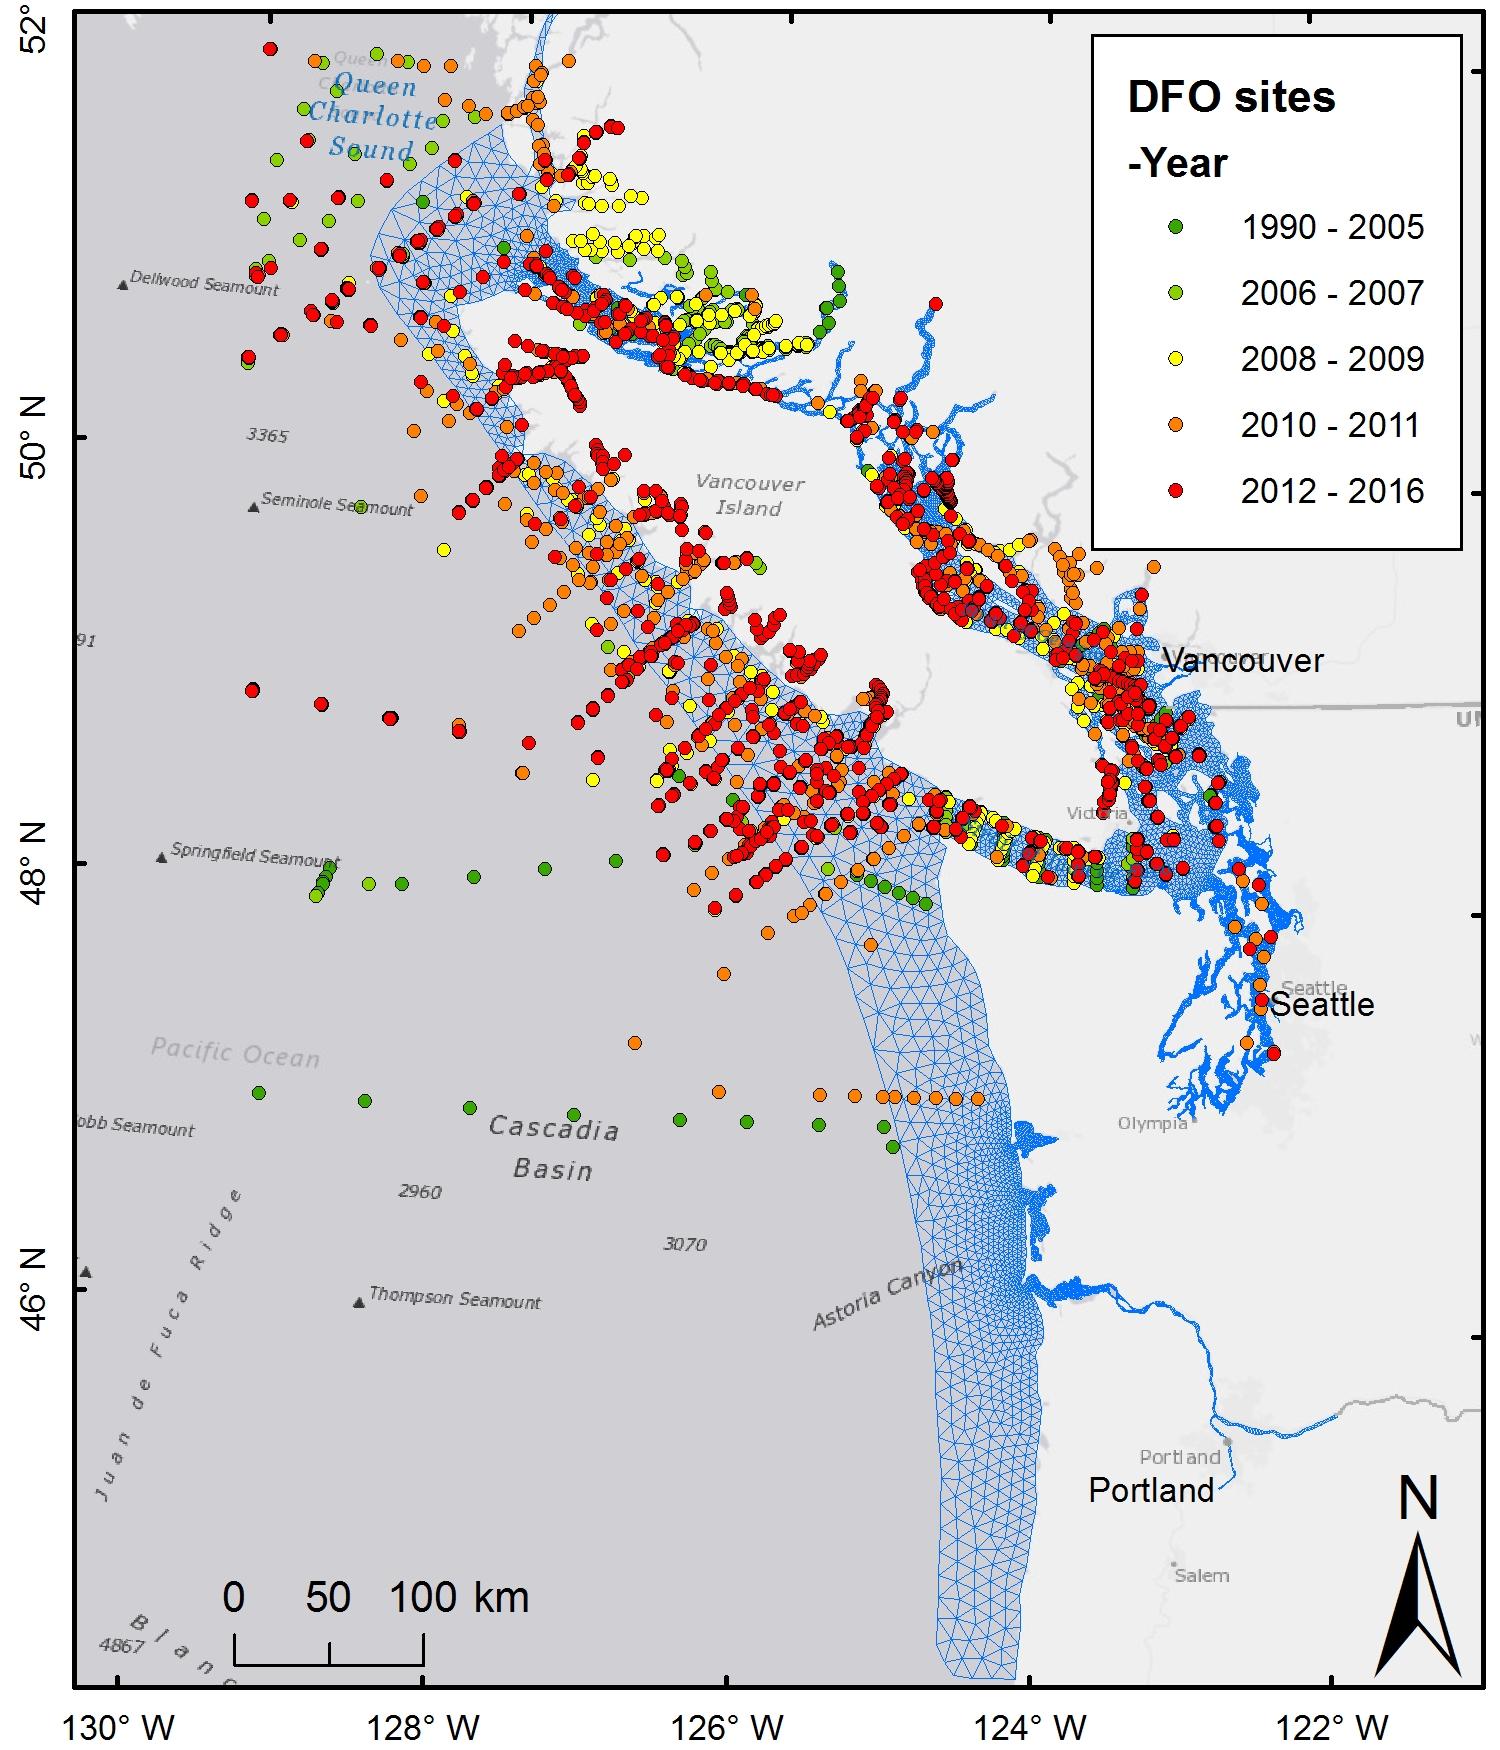
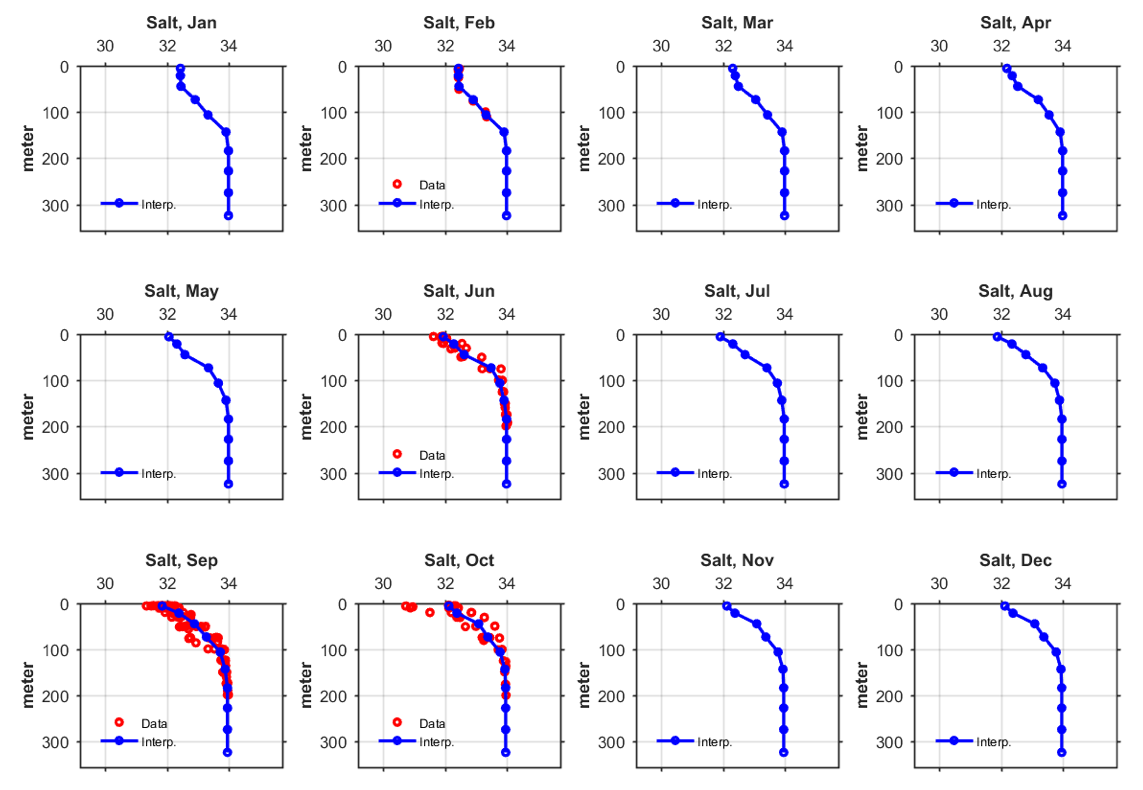
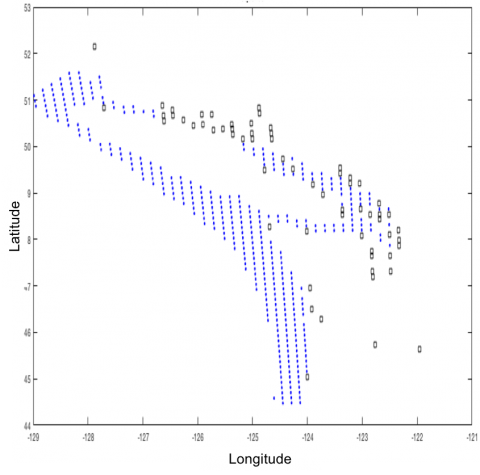
Temperature and salinity profiles along the open boundaries are currently specified based on quarterly observations conducted by Department of Fisheries and Oceans, Canada (DFO). Temperature and salinity profiles collected from various locations over the continental shelf are selected using a proximity polygon surrounding the Salish Sea Model ocean boundary.

Selected T and S profiles are then interpolated to the model ocean boundary in time and space, resulting in monthly OBC profiles (an example is shown below).

temp
Example of SSM OBC salinity profiles at a representative boundary node in Year 2014, generated from DFO quarterly monitoring. Red dots are selected DFO data that are within the proximity polygon in and within the particular month.

Meteorological Forcing

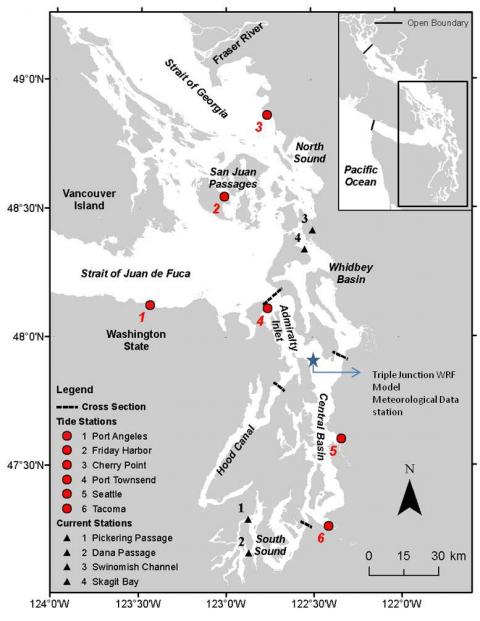
Meteorological parameters for calculation of net heat flux in the Salish Sea Model (SSM) include 1) downward and upward shortwave radiation, 2) downward and upward longwave radiation, 3) latent heat flux, and 4) sensible heat flux. These meteorological parameters were obtained from the weather research forecasting (WRF) model reanalysis data generated by the University of Washington. Available data were on a 12-km grid. The over-water stations are shown below along with nearshore land nodes that were identified and removed from consideration as part of QA/QC.

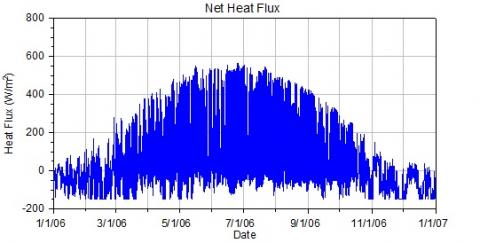
The Strait of Juan De Fuca, Triple Junction, and Vashon Island stations were found to best represent over-water stations, for the Puget Sound region and were least affected by albedo effects. WRF-generated net heat flux values required an adjustment (% reduction) to account for a combination of albedo over water and as part of calibration to provide the best match with observed sea-surface temperatures for the selected model surface layer thickness fraction relative to water depth. The figure below shows an example of net heat flux at the Triple Junction station that was used in model calibration based on WRF-predicted values.

Meteorological Forcing
SSM Net Head Flux
Net heat flux time history based on WRF model predictions over Puget Sound developed as part of model calibration to observed sea surface temperatures.

Hydrodynamics Model Validation and Error Analysis

Tide and current data stations

Six real-time tidal stations are maintained by the National Oceanic and Atmospheric Administration (NOAA) throughout the Straits and Puget Sound. Velocity data on the other hand are quite limited in Puget Sound as well as Georgia Basin regions of Salish Sea. Acoustic Doppler current profiler (ADCP) data in South Puget Sound (Roberts et al. 2008) as well as in Skagit Bay and Swinomish Channel (Yang and Khangaonkar 2010) were used for original model calibration. Monthly T/S profiles collected by the Washington State Department of Ecology as part of its ambient monitoring program throughout Puget Sound were also used. Hydrodynamic model calibration was conducted using Year 2006 data and has been discussed by Khangaonkar et al. (2011a) and Khangaonkar et al. (2012) and more recently in Khangaonkar et al. (2017a).

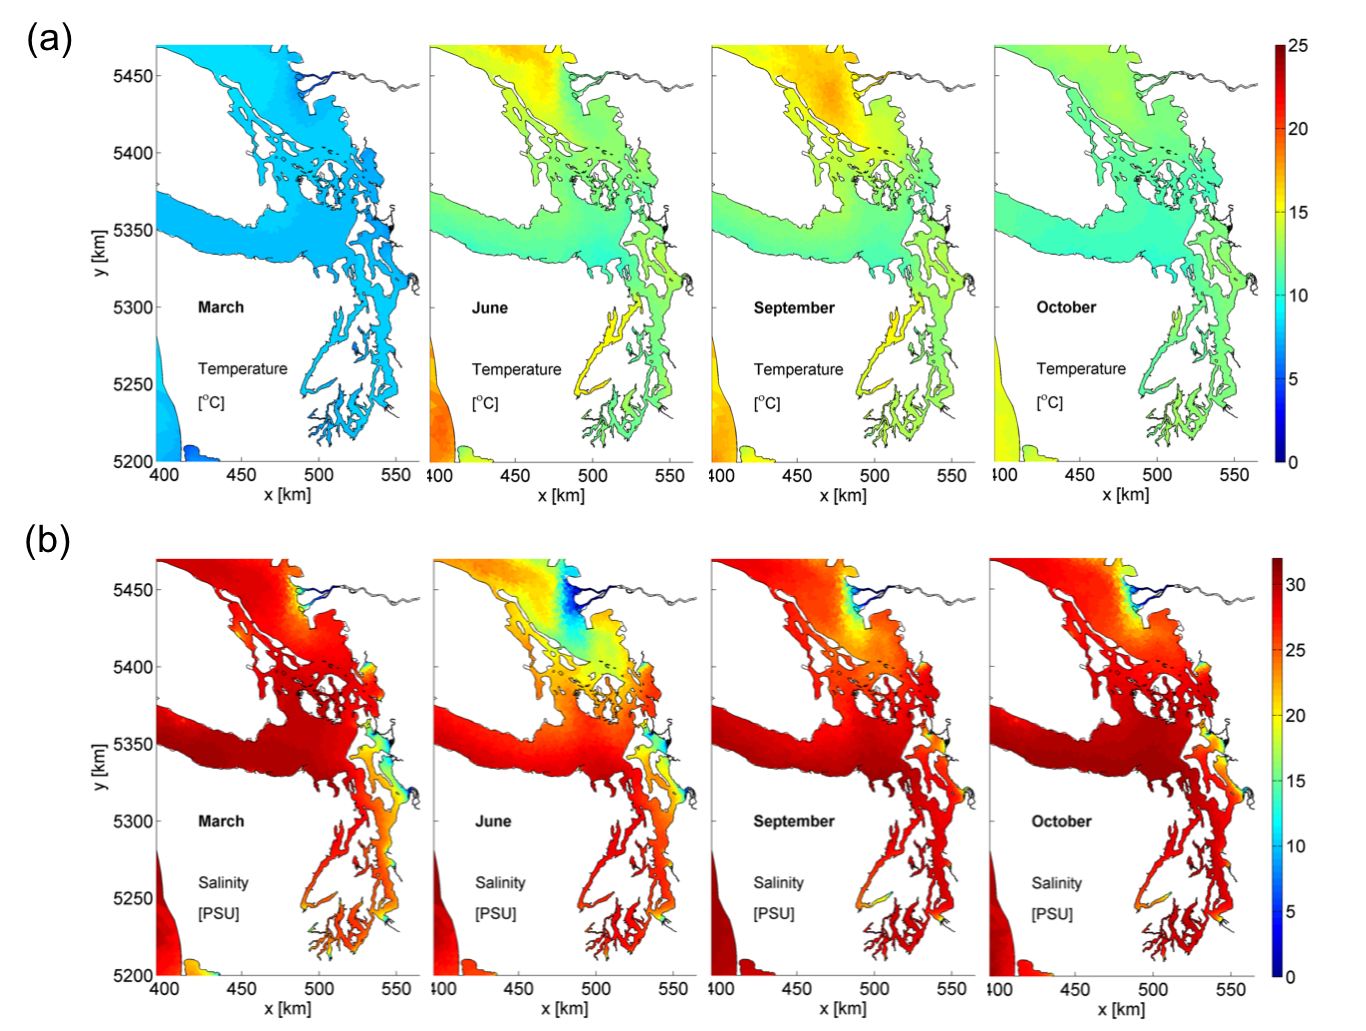
Model validation was conducted using Year 2014 data for water surface elevation, temperature and salinity using nine tide stations (X-Tide stations, Flater 1996) and the same 24 water quality stations maintained by Ecology. Relative water-surface elevation errors were less than 10% at all stations within Puget Sound in U.S. waters. Domain-wide temperature (T) RMSE was 0.76ºC with a bias of -0.27ºC. The domain-wide salinity (S) error was 0.97 ppt with a bias of -0.12 ppt. Model skill scores were also high for T and S with Wilmott Skill Score (WSS) values of 0.95 and 0.84, respectively. The Salish Sea Model validation is described in Khangaonkar et. al 2018.

The influence of the Fraser River plume on sea surface T and S is noticeable in all seasons. Furthermore, monitoring data shows that sea surface temperatures in the Strait of Georgia and Hood Canal region warm up earlier than other sub-basins and are captured well by the model.

tempsalinity
The figure shows (a) Sea surface temperature and (b) Salinity contour plots for representative days in spring (March), summer (June), fall (September), and winter (December) 2014.

Validation Example

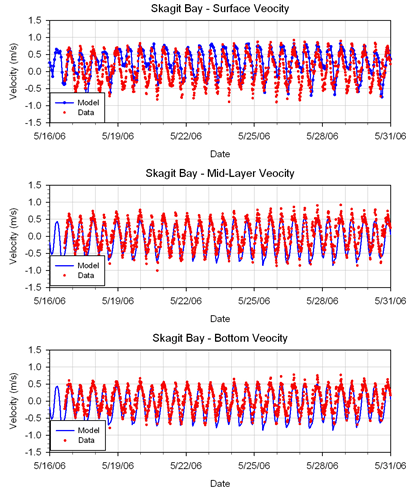
Examples of model validation results with comparison to observed data for Year 2006 effort are shown below along with error analysis tables.

(a) Time series plots for water-surface elevation and currents.

hydro validation

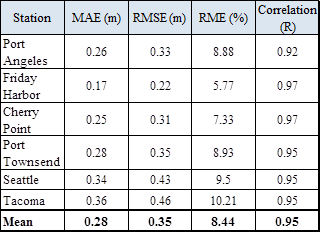
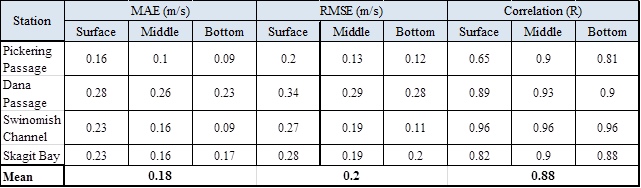
(b) Error analysis tables for water-surface elevation (top) and currents (bottom).

water surface elevation
currents


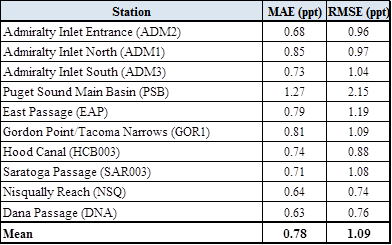
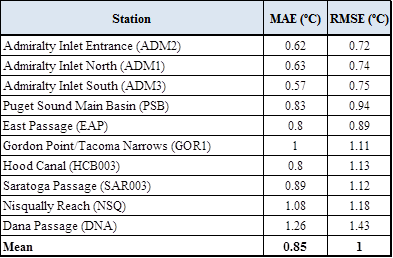
(c) Salinity and temperature time series and profiles.

st profiles
ssm salinity

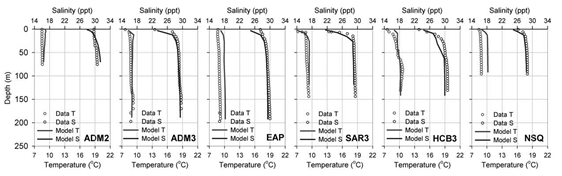
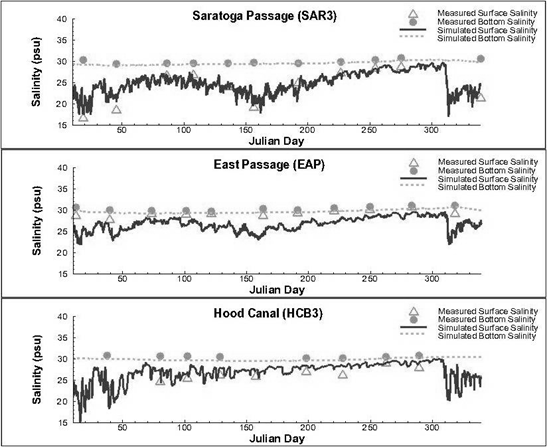
(d) Salinity and temperature error analysis table.

salinity error
temp error

Contact

Tarang Khangaonkar
Program Manager, Coastal Ocean Modeling
tarang.khangaonkar@pnnl.gov
206-528-3053

PNNL

  • Get in Touch
    • Contact
    • Careers
    • Doing Business
    • Environmental Reports
    • Security & Privacy
    • Vulnerability Disclosure Program
  • Research
    • Scientific Discovery
    • Sustainable Energy
    • National Security
Subscribe to PNNL News
Department of Energy Logo Battelle Logo
Pacific Northwest National Laboratory (PNNL) is managed and operated by Battelle for the Department of Energy
  • YouTube
  • Facebook
  • Twitter
  • Instagram
  • LinkedIn