Wave Energy
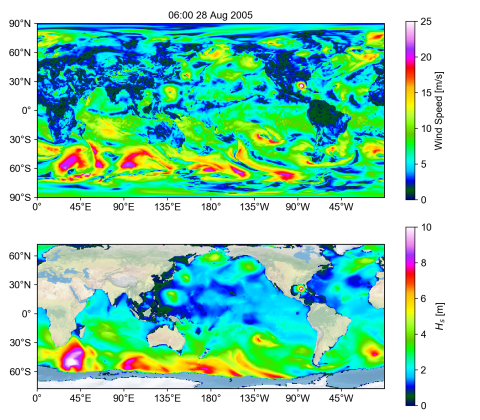
Interest has recently increased in the area of wave energy as a carbon-free energy source, yet resource estimates of wave energy available for extraction at regional scales are uncertain. The Ocean Dynamics Modeling group has used high-fidelity third-generation wave models such as SWAN and WaveWatch3 to map the available wave energy resource in U.S. coastal regions in the Pacific Ocean.
Projects
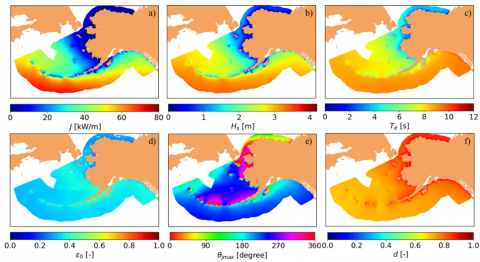
High-resolution Wave Resource Characterization along the Alaskan Coast. A wave resource characterization was performed for the Alaska coast based on a 32-year high-resolution hindcast. Statistics for the six IEC wave resource parameters were calculated and aggregated at 20 km from shore to quantify wave power and its variability at a regional scale. A near-shore resource assessment was performed by evaluating resource hotspots located 1 km from shore.
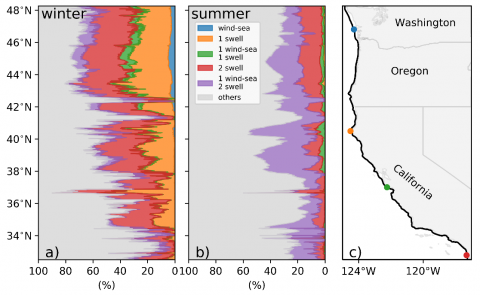
Near-shore Wave Resource Characterization on the West Coast. A detailed analysis of the near-shore wave resource was carried out on the U.S. West Coast based on a 32-year regional wave hindcast. Statistics of six IEC wave resource parameters at a water depth of 50 m were calculated for four sub-regions along the coast, namely Washington, Oregon, and Northern and Southern California. Results indicate that the Washington and Oregon coasts have the most near-shore wave resource. A detailed characterization of the multimodal sea states indicate mixed seas are more prevalent during the summer months. During the winter, swell waves dominate with one or two components being more prevalent in Oregon and Washington.
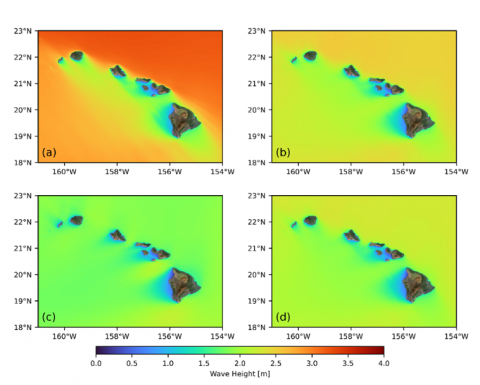
Wave Energy Resources Characterization for the Multimodal Sea State of Hawaii. This study partitioned wave spectral energy based on a high-resolution 32-year wave hindcast for Hawaii. The partitioned hindcast spectra allow separate seasonal descriptions of dominant components from wind seas to swells for in-depth understanding of the wave climate and proper categorization of wave energy resources using the six IEC parameters for Hawaii.
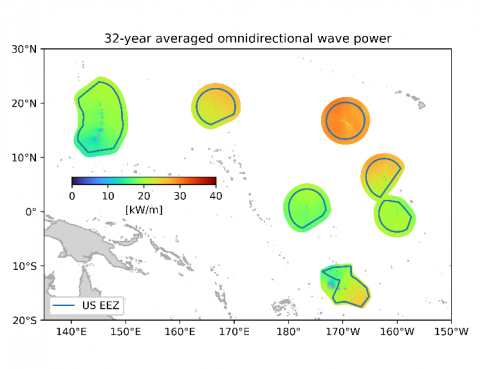
Wave Energy Resources Characterization for the U.S. Pacific Territory Islands. This study included the development of seven wave models with a coastal resolution of 100 m to characterize the wave energy resource for the U.S. Pacific Territories. The models were validated against data provided by in situ and satellite-borne measurements. We are currently analyzing the model results and characterizing the resource.
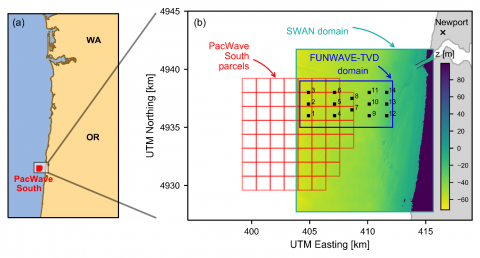
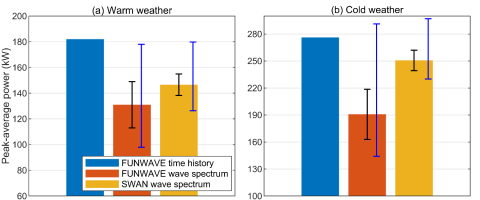
Time and Frequency Domain Wave Modeling of a Wave Energy Converter (WEC) Array. Two distinct numerical wave models were compared with respect to their influence on the power estimation of a 14-device WEC array. The time domain model, FUNWAVE, is phase-resolving and nonlinear, and the frequency domain model, SWAN, is phase-averaged and linear. The wave models were set-up to simulate the climate conditions that a hypothetical WEC farm would experience if situated at the PacWave South testing site off-shore from Newport, Oregon. Results show that using phase-resolved wave forcing (FUNWAVE time histories) to calculate the hydrodynamic response of WECs led to larger estimates of peak-average power than when using phase-averaged wave forcing, suggesting that there may be large wave events that are underpredicted when phase and nonlinear wave transformations are not resolved which could affect the performance and survivability of WECs.
This work was funded by the Department of Energy Water Power Technologies Office.