We provide a series of datasets produced or used by the DHSVM model. If you use these data sets, please cite the corresponding references. Contact us for more details or to inquire about forthcoming datasets.
Bias Correction and Quality Control (BCQC) SNOTEL Data data (compressed zip file, through 09/30/2021) for 829 active stations located in the western United States and Alaska are available to download. The BCQC procedures are briefly described below. For details, the users are referred to Sun et al. (2019) for bias correction (BC) procedure and Yan et al. (2018) for quality control (QC) procedure.
- Download file here (.zip):
- Summary file of SNOTEL stations (.zip)
Please note: if you decide to use this data, please cite the following two references:
- Sun N, H Yan, M Wigmosta, R Skaggs, R Leung, and Z Hou. 2019. “Regional snow parameters estimation for large-domain hydrological applications in the western United States.” Journal of Geophysical Research: Atmospheres. doi: 10.1029/2018JD030140
- Yan H, N Sun, M Wigmosta, R Skaggs, Z Hou, and R Leung. 2018. “Next-generation intensity-duration-frequency curves for hydrologic design in snow-dominated environments.” Water Resources Research, 54(2), 1093–1108.
BCQC SNOTEL Data Overview
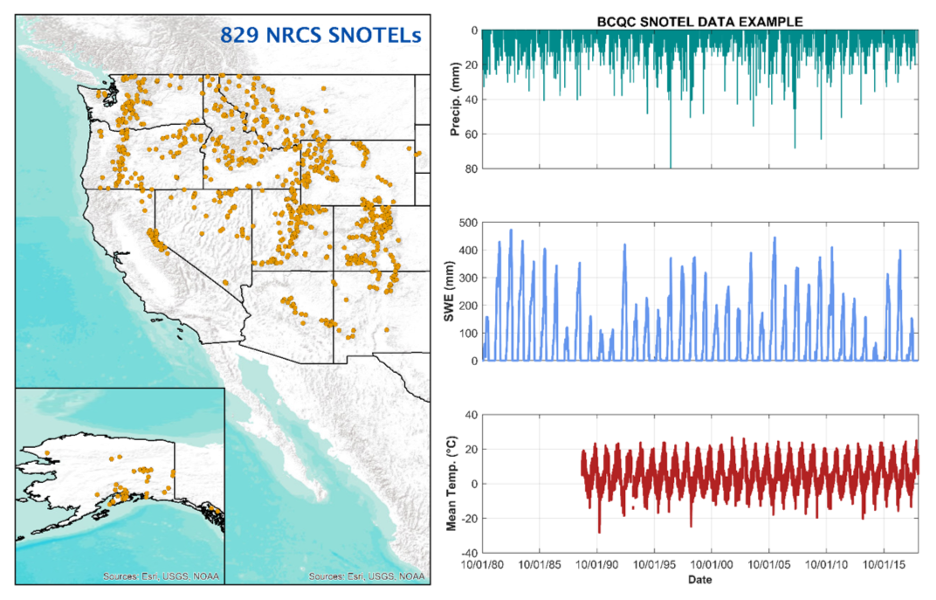
BCQC SNOTEL data consists of bias-corrected and quality-controlled daily snow water equivalent (SWE), meteorological records including daily minimum, maximum, and mean air temperature, and daily total precipitation through 09/30/2021 for 829 active stations located in the western United States and Alaska (Figure 1).
In a Water Resources Research (WRR) commentary, Hamlet (2018) noted: “a new data set produced by Yan et al. (2018) will likely be an important validation resource for hydrologic and atmospheric modelers.”
BCQC Procedures
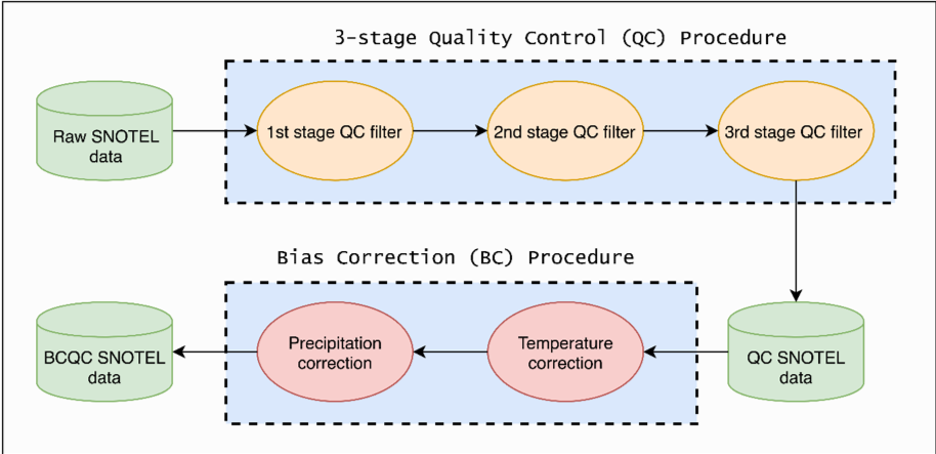
All raw data at each SNOTEL were first screened using a three-stage quality control (QC) filter (Yan et al., 2018). The first and second stage filters were initially developed by Serreze et al. (1999) and enhanced by Yan et al. (2018). The first stage filter identified and eliminated outliers and erroneous values (i.e., negative SWE) and adjusted potential erroneous accumulated precipitation values. The second stage filter identified and eliminated additional outliers based on statistical measurements (i.e., daily SWE increase more than five standard deviations). The third stage filter identified and eliminated inconsistent SWE and precipitation observations (i.e., SWE exceeds accumulated precipitation by 5%).
After the three-stage filter, the quality-controlled SNOTEL SWE, temperature, and precipitation data were corrected for temperature and precipitation biases (Sun et al., 2019). The SNOTEL air temperatures were corrected for warm bias at cold temperatures. SNOTEL precipitation measurements were bias corrected for potential under-catch of snowfall from wind processes and wetting loss on the collector walls. Figure 2 presents the workflow of the BCQC procedures.
BCQC Data Format
The file of each SNOTEL station is named as “bcqc_<latitude>_<longitude>.txt” (i.e., bcqc_44.43000_-120.33000.txt). In each text file, there are 8 columns separated by a space delimiter:
- 1st col: year
- 2nd col: month
- 3rd col: day
- 4th col: daily precipitation, in inch
- 5th col: maximum air temperature, in °F
- 6th col: minimum air temperature, in °F
- 7th col: mean air temperature, in °F
- 8th col: SWE, in inch, reset to zero on 1 October at the start of each water year
In each text file, “nan” indicates missing or filtered out data after the BCQC procedures.
>Note: For each SNOTEL station, you can find its information (based on latitude and longitude) in the summary file>, which details the SNOTEL ID, location (in latitude and longitude), located state, elevation, name, data start date, and end date.
Raw SNOTEL Data
The raw daily SNOTEL SWE measurements and meteorological records were acquired from USDA NRCS. The raw data for 829 SNOTEL stations were compiled and compressed into one zip file that are available for download.
Download here: raw SNOTEL data.
Raw SNOTEL data has similar format to BCQC data. Each station is named as “raw _<lat>_<lon>.txt” and has 9 columns separated by a space delimiter. The 1–3 col: year, month, and day. The 4th col: accumulated precipitation in inch (reset to zero on 1 October). The 5th col: daily precipitation in inch. The 6–8 col: maximum, minimum, and mean air temperature in °F. The 9th col: SWE in inch (reset to zero on 1 October). In each text file, “nan” indicates missing data.
Data Maintenance and Inquiry
The PNNL Computational Watershed Hydrology team maintains BCQC SNTOTEL data and will make updates periodically to extend the data to the latest available SNOTEL records. For questions about the BCQC SNOTEL data, contact:
Acknowledgements
Funding for initial development of this dataset was provided by the Strategic Environmental Research and Development Program under contract RC-2546. Key previous studies to evaluate and/or improve the quality of mountainous gauge observations are included in the reference section. Recent publications that analyze or use the BCQC SNOTEL data are also included in the reference section.
BCQC SNOTEL Data Relevant Publications
- Sun N, H Yan, M Wigmosta, R Skaggs, R Leung, and Z Hou. (2019). “Regional snow parameters estimation for large-domain hydrological applications in the western United States.” Journal of Geophysical Research: Atmospheres.
- Yan H, N Sun, M Wigmosta, R Skaggs, Z Hou, and R Leung. (2019). “Next-generation intensity-duration-frequency curves to reduce errors in peak flood design.” Journal of Hydrologic Engineering.
- Yan H, N Sun, M Wigmosta, R Skaggs, R Leung, A Coleman, and Z Hou. (2019). “Observed spatiotemporal changes in the mechanisms of extreme water available for runoff in the western United States.” Geophysical Research Letters, 46(2), 767–775.
- Hamlet A. (2018). “New observed data sets for the validation of hydrology and land surface models in cold climates.” Water Resources Research, 54(8), 5190–5197.
- Yan H, N Sun, M Wigmosta, R Skaggs, Z Hou, and R Leung. (2018). “Next-generation intensity-duration-frequency curves for hydrologic design in snow-dominated environments.” Water Resources Research, 54(2), 1093–1108.
- Currier W, T Thorson, and J Lundquist. (2017). “Independent evaluation of frozen precipitation from WRF and PRISM in the Olympic Mountains.” Journal of Hydrometeorology, 18(10), 2681–2703.
- Harms D, J Weeks, and J Lea. (2016). “Comparing SNOTEL extended air temperature sensor and equations to an NSIT certified sensor in an environmental chamber.” 84th Annual Western Snow Conference, Seattle, WA.
- Oyler J, S Dobrowski, A Ballantyne, A Klene, and S Running. (2015). “Artificial amplification of warming trends across the mountains of the western United States.” Geophysical Research Letters, 42(1), 153–161.
- Livneh B, J Deems, D Schneider, J Barsugli, and N Molotch. (2014). “Filling in the gaps: Inferring spatially distributed precipitation from gauge observations over complex terrain.” Water Resources Research, 50(11), 8589–8610.
- Meyer J, J Jin, and S Wang. (2012). “Systematic patterns of the inconsistency between snow water equivalent and accumulated precipitation as reported by the snowpack telemetry network.” Journal of Hydrometeorology, 13(6), 1970–1976.
- Serreze M, M Clark, and A Frei. (2001). “Characteristics of large snowfall events in the montane western United States as examined using snowpack telemetry (SNOTEL) data.”Water Resources Research, 37(3), 675–688.
- Serreze M, M Clark, R Armstrong, D McGinnis, and R Pulwarty. (1999). “Characteristics of the western United States snowpack from snowpack telemetry (SNOTEL) data.” Water Resources Research, 35(7), 2145–2160.
- Groisman P and D Legates. (1994). “The accuracy of United States precipitation data.” Bulletin of the American Meteorological Society, 75(2), 215–228.