Spectral Induced Polarization (SIP)
Characterization • Laboratory Tank-Scale Imaging
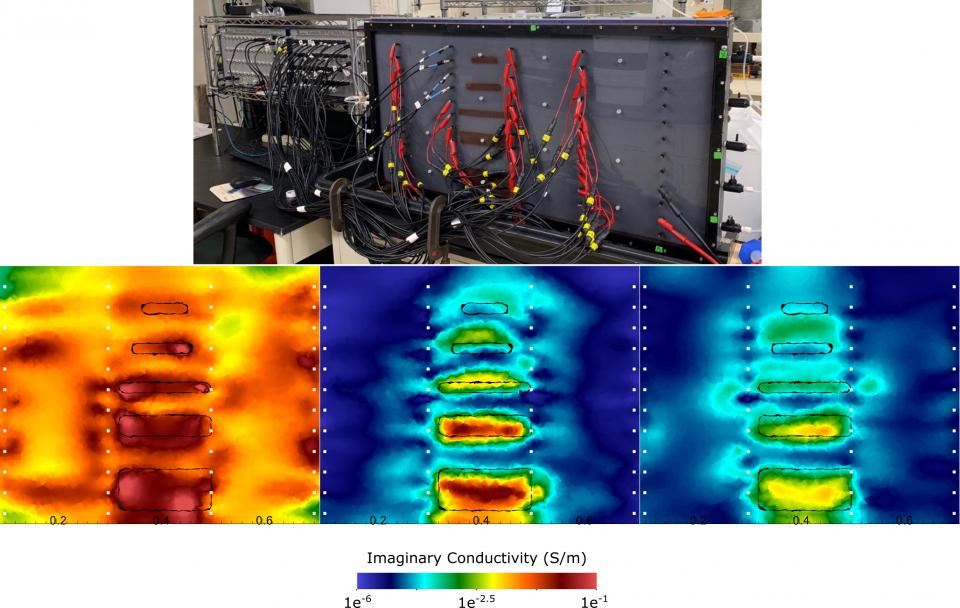
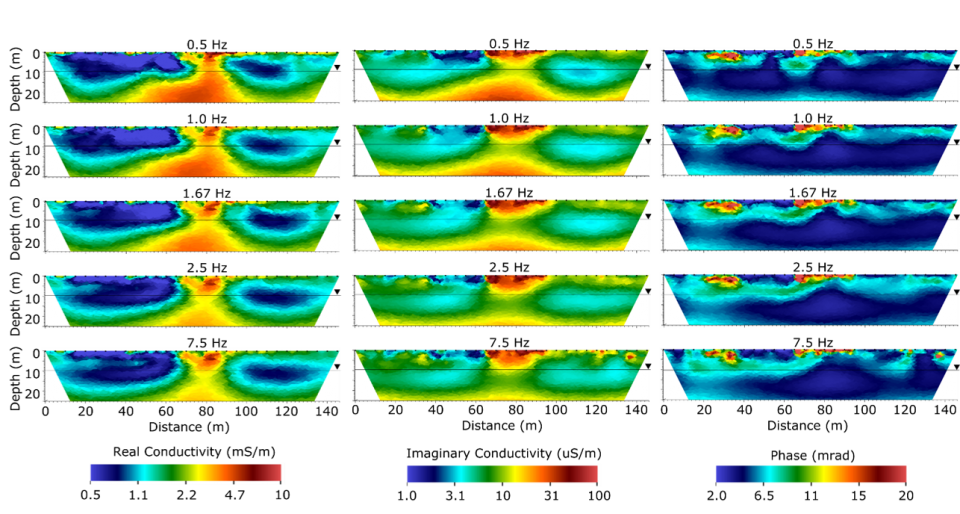
The SIP response has been linked to pore and grain size distribution, specific surface area, minerology, hydrogeologic properties and biogeochemical processes. E4D provides a computationally efficient way to model and invert SIP data in the real number domain while allowing the same physically-based incorporation of known data as in ERT.
1. Characterization
2. Laboratory Tank-Scale Imaging