Mapping the Future of Data Centers: A New Public Tool Illuminates What’s Next
PNNL's new Data Center Atlas offers free access to data center location and infrastructure data once limited to proprietary datasets, allowing users to explore and project a nationwide map of facilities and the systems that power them
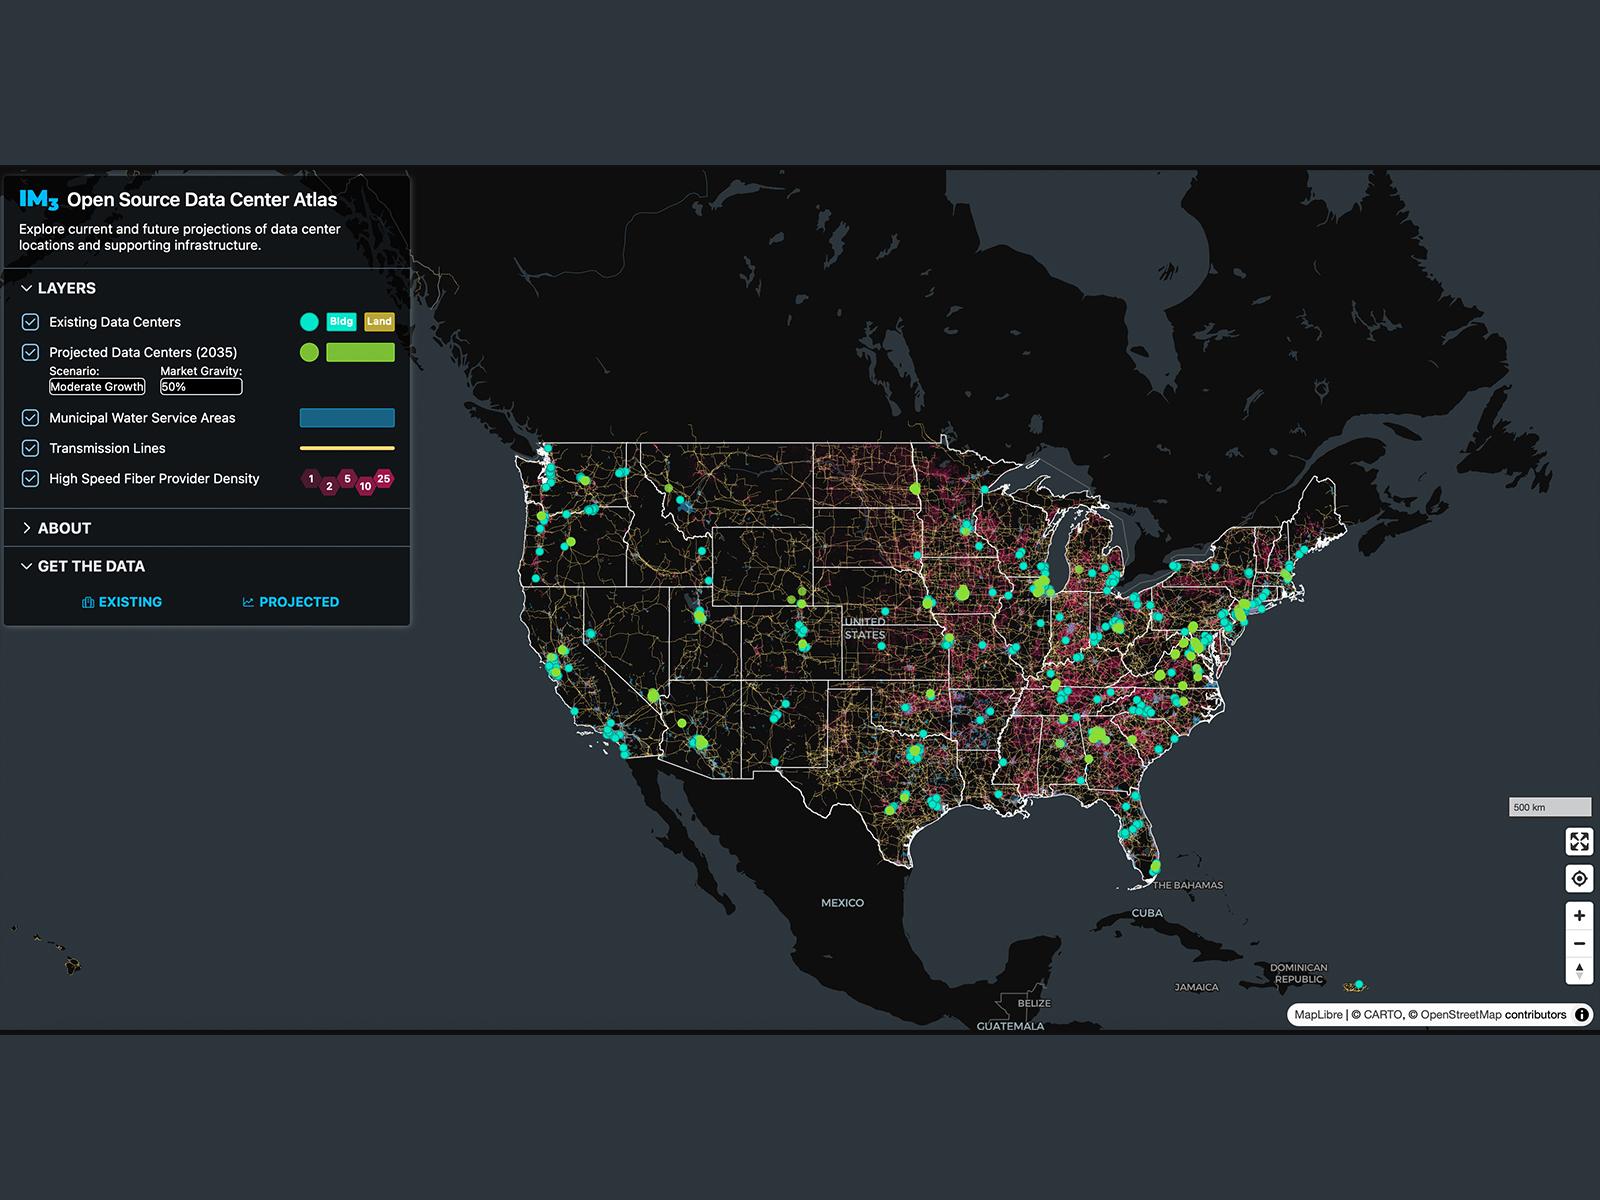
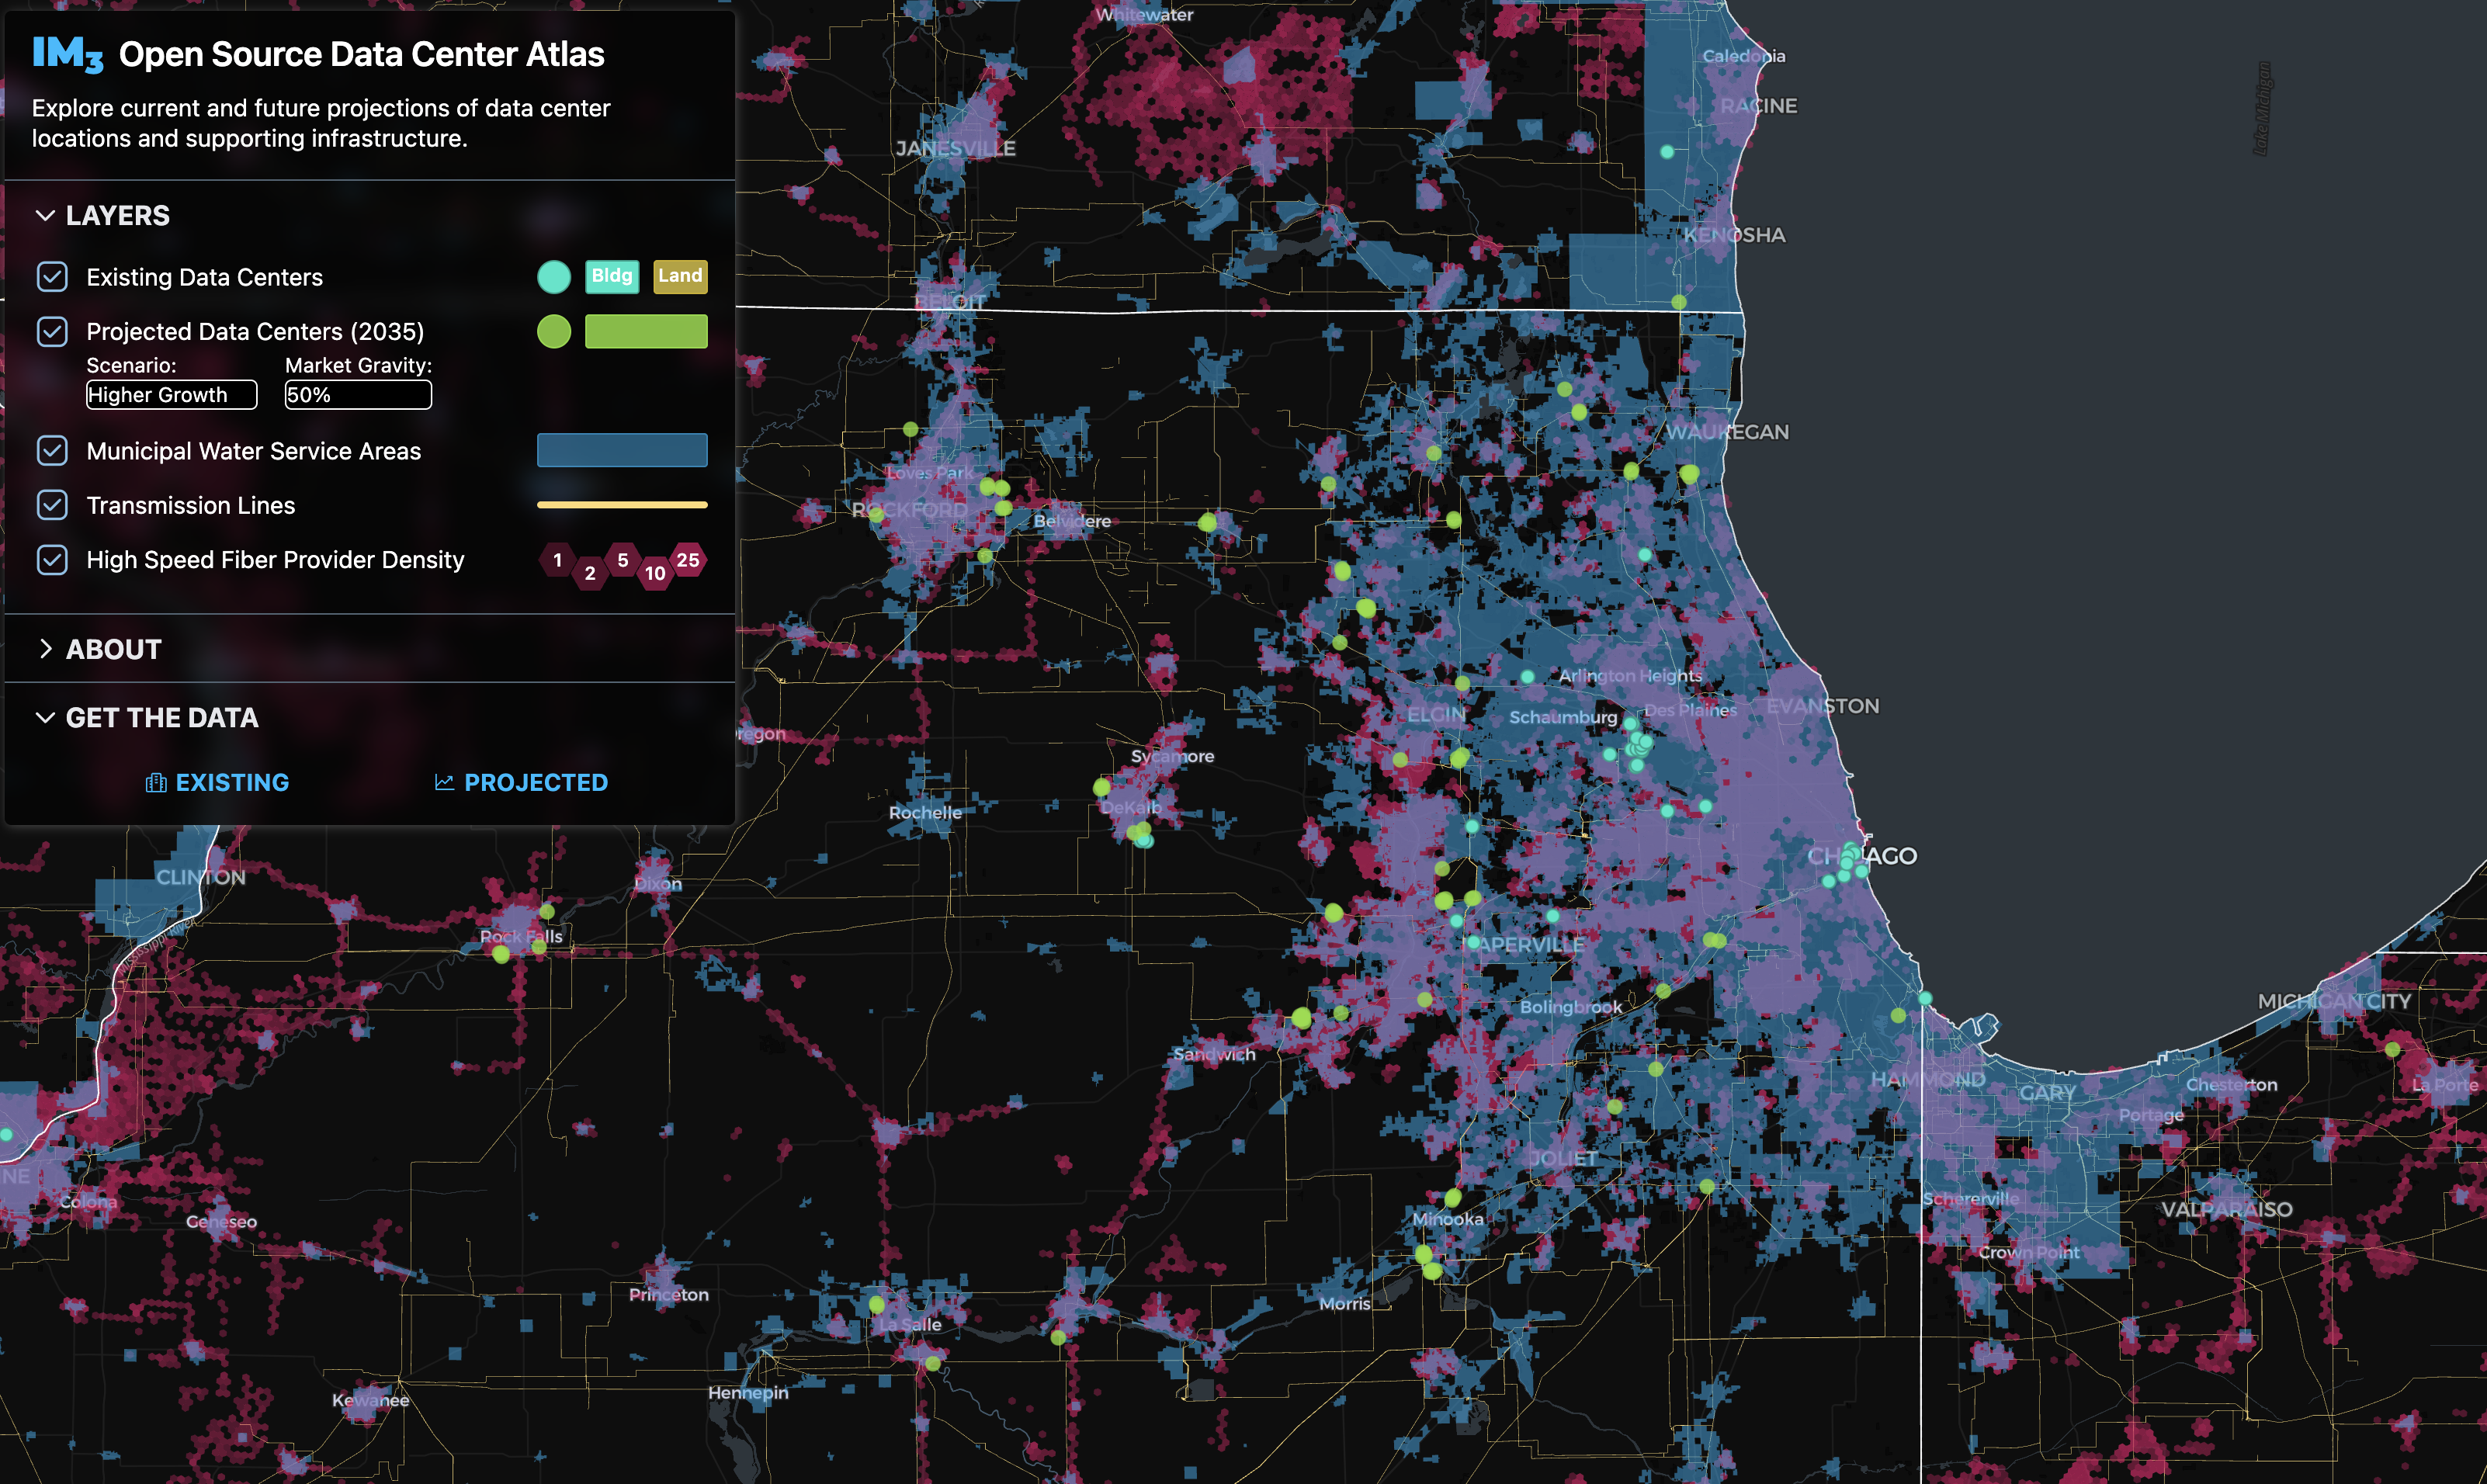
A screenshot of the dashboard interface with all supporting infrastructure layers showing.
(Image courtesy of Kendall Mongird | Pacific Northwest National Laboratory)
As more aspects of daily life shift online, the physical infrastructure supporting that shift is growing rapidly—often faster than anyone expected. Data centers, which power everything from web searches to artificial intelligence, are growing in number in response to increasing demand for computing power. But understanding where they are located—and anticipating where they may go next—has been a challenge.
To help address that gap, researchers at Pacific Northwest National Laboratory created the Data Center Atlas, a public tool that offers detailed, downloadable information about the national distribution of data centers and projections of new data center locations.
The project team assembled open-source data on data centers and combined it into a street-level map that shows data center locations across the United States. They then layered in supporting infrastructure—high-speed internet fiber, electricity, and water—all critical components that shape where data centers can operate.
From mapping the present to projecting the future
While the Atlas allows users to explore where data centers exist today, it also includes a unique feature: a projection component that suggests where new hyperscale data centers are most likely to appear tomorrow.
These projections are based on common siting preferences and infrastructure access patterns. They allow researchers and energy planners to evaluate data center growth scenarios across a range of trajectories. This dual view—both present and projected—provides critical context for anyone working to understand the energy, water, and land implications of data centers.
Data you can use and build on
Unlike many data center maps that limit users to visual exploration, the Atlas allows full download access to the data behind the map. This means the resource is not just a visualization—it is a foundation for further work. Researchers can integrate this location data into their modeling efforts. For example, utilities can use it to consider potential demand impacts of further data center development on the grid, while regional water suppliers can compare the projected locations with their planning assumptions.
Because the dataset is open source, it can also be improved over time. The research team hopes the Atlas will support more collaborative, transparent infrastructure planning efforts as data center development accelerates.
By making the tool open and accessible, the creators hope it can support informed conversations about tradeoffs, co-benefits, and long-term planning for data centers from local to national scales.
The research behind the resource
The Data Center Atlas is a product of the Integrated Multisector, Multiscale Modeling (IM3) project, part of the Department of Energy’s investment in multisector dynamics, providing foundational scientific research and tools for human and Earth system interactions that can be further developed into real-world applications.
Explore the Atlas
The Data Center Atlas is available to the public at:🔗https://im3.pnnl.gov/datacenter-atlas
Users can explore current data center locations, infrastructure overlays, and growth projections or download the full dataset for further analysis.
Published: January 21, 2026
Mongird, Kendall, Travis Thurber, Chris Vernon, Casey Burleyson, Kerem Ziya Akdemir, and Jennie Rice. “IM3 Open Source Data Center Atlas.” MSD-LIVE Data Repository, June 6, 2025.