Watching the Cold War’s Environmental Footprint Shrink
New tool tracks groundwater remediation efforts at contaminated DOE sites around the U.S.
The Tracking Restoration And Closure (TRAC) tool enables information sharing about and provides transparency into environmental remediation progress at certain Department of Energy Office of Environmental Management (DOE-EM) sites nationwide.
(Photo of Rocky Flats Site and TRAC logo | DOE; Composite image by Shannon Colson | Pacific Northwest National Laboratory)
A new web-based mapping application offers unprecedented transparency into environmental cleanup progress at sites contaminated because of Cold War-era nuclear initiatives in the U.S.
The Tracking Restoration And Closure (TRAC) tool combines diverse data—including photos, infographics, annual statistics, and narrative information—to clearly and consistently communicate the status of groundwater contamination cleanup efforts at Department of Energy Office of Environmental Management (DOE-EM) sites nationwide. Developed for DOE-EM by researchers at Pacific Northwest National Laboratory (PNNL), TRAC is now publicly available.
TRAC, which was jointly funded by the DOE-EM Technology Development Program and Office of Subsurface Closure, currently provides information on cleanup progress at the Hanford Site in Benton County, Washington; the Idaho National Laboratory site near Idaho Falls, Idaho; and the Savannah River Site in Aiken, South Carolina.
Tracking cleanup of legacy nuclear waste
The Office of Environmental Management was established in 1989 to address contamination resulting from five decades of nuclear weapons production and government-sponsored nuclear energy research, entailing the largest environmental cleanup program in the world. From its inception through 2022, DOE-EM has reduced the number of contaminated sites under active cleanup from 107 sites in 31 states to 15 sites in 11 states.
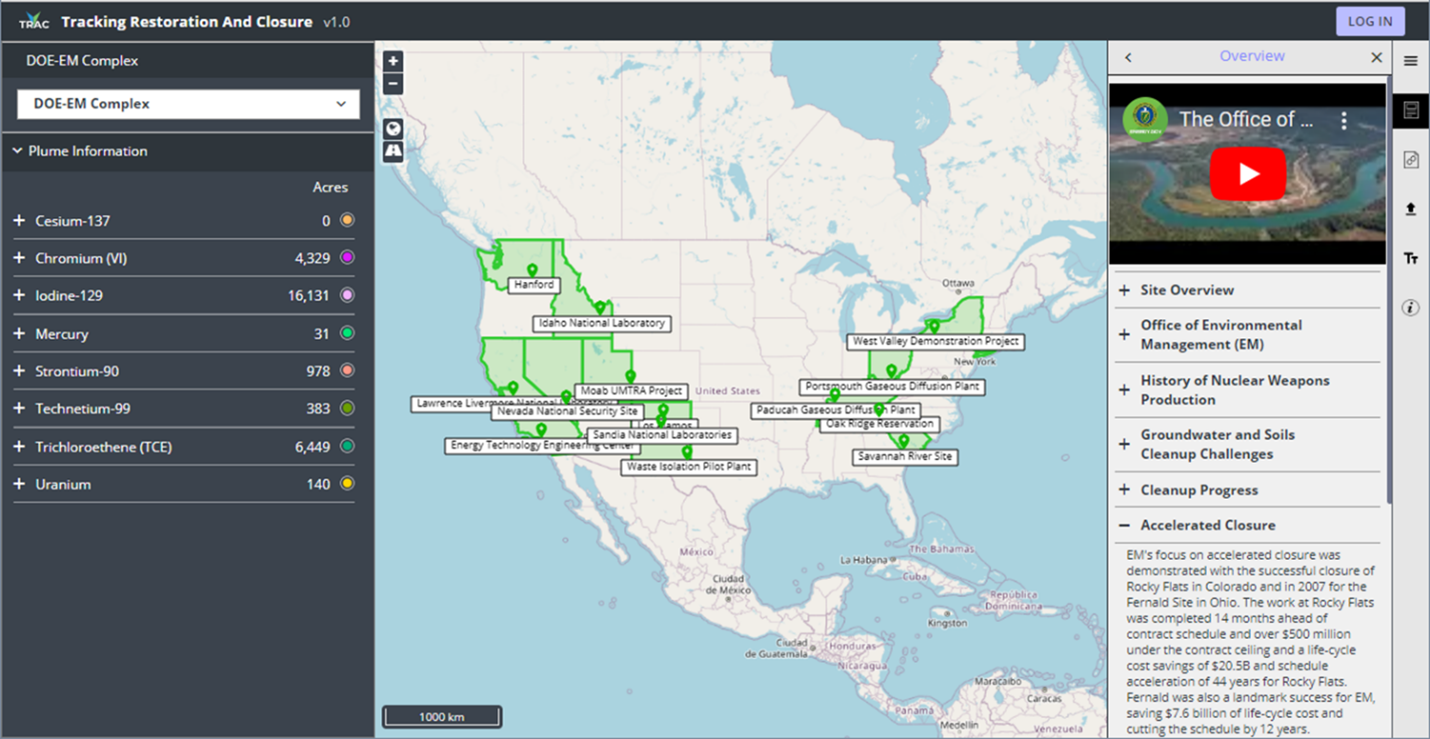
TRAC was developed to share information about and provide transparency into cleanup progress at these remaining sites. Now, anyone can learn more and follow ongoing efforts using the dynamic mapping tool by viewing overall or site-specific summary information. For example, users can explore geospatial visualization of “contaminants of concern” and see explanatory text, photographs, video, contaminant plume animations, and tabular metrics on cleanup progress at represented sites in the DOE-EM complex.
“TRAC’s primary purpose is communication,” said Christian Johnson, a senior development engineer at PNNL and project manager for TRAC development. “This includes facilitating communication between EM sites and DOE headquarters, with congressional representatives, and with environmental stakeholders, regulators, and the public. It clearly conveys which contaminants are the focus at each site, how groundwater contaminant plumes are changing over time, how cleanup is being approached, and progress toward completion under the EM program.”
The insights offered by TRAC also promote knowledge transfer among sites in the DOE-EM complex, providing a single, consistent framework that streamlines the sharing of technology solutions, successes, and lessons learned. While there is no one-size-fits-all approach to this complex environmental cleanup challenge, TRAC provides an opportunity for sites to benefit from a central knowledge bank.
In an announcement about TRAC’s release, DOE-EM said the information sharing that TRAC enables “is needed to develop and track a complex-wide groundwater closure strategy, maintain open communications with interested parties, and communicate efforts that ensure long-term protection of human health and the environment.”
Exploring under the surface
Users of TRAC have a lot to discover. Clicking on a priority contaminant will show which sites have it, the footprint size of impacted groundwater, and status of remediation. Digging into available narrative content sheds light on the conceptual site models, contaminant release history, and technologies being applied in the environmental restoration efforts.
“The tool provides high-level summary information for a look at what’s happening across the EM complex, with three levels of detail to explore,” said Johnson. “It is not intended to provide specific contaminant concentrations at monitoring wells, but rather gives an overview about many aspects of cleanup efforts at each level, including goals for closure at each site and progress toward the end-state cleanup outcome.”
The drill-down levels of available data include DOE-EM complex, site, and waste management unit or operable unit, which is a distinct portion of a site where cleanup progress is tracked independently. Users will find the most specific detail and visualization of groundwater contaminant concentrations and progress metrics at the operable unit level.
Next steps for TRAC
While TRAC currently provides data for three cleanup sites, information about the remaining sites in the DOE-EM complex will be added soon, and all represented sites will update the tool annually to keep the data and visuals current.
As more sites add their groundwater contamination data to the tool, Johnson is thinking ahead to what more TRAC could be expanded to convey.
“I’m excited about the capabilities we already have built into TRAC, but also about other types of information and functionality we could add in the future,” said Johnson. “I could envision its coverage going beyond groundwater to other types of contamination such as soil or even tank waste.”
Learn more about TRAC or start exploring the application as a “guest” user.
Published: October 20, 2022