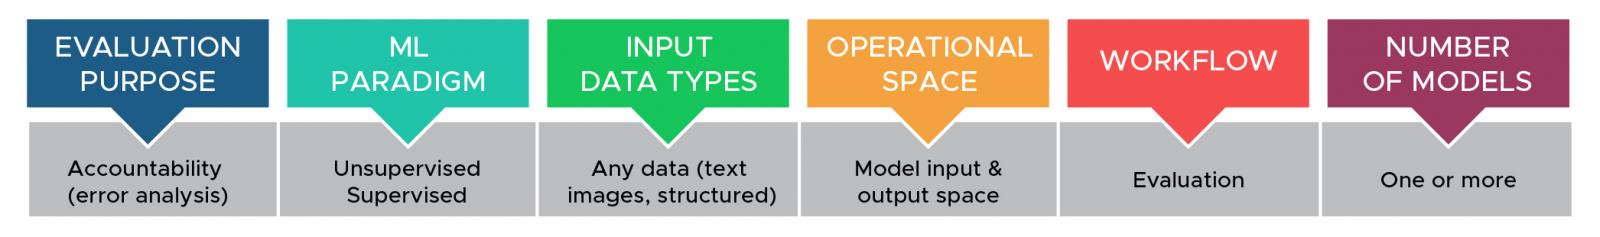
ErrFilter
ErrFilter is an exploratory visualization tool for error analysis to explain multimodal machine learning model predictions. It combines cross-filtering on the model input/output space to allow the user to understand characteristic examples and miss-classifications across the predictive classes in a test dataset. We applied ErrFilter to explaining multimodal deceptive news prediction models trained on images and text from Twitter, and the tool revealed the unique patterns that the model errors associated with each misinformation type.
CrossCheck
CrossCheck is an interactive tool for rapid cross-model comparison and reproducible error analysis. CrossCheck enables users to make informed decisions when choosing between multiple models, identify when the models are correct and for which examples, investigate whether the models are making the same mistakes as humans, evaluate models' generalizability, and highlight models' limitations, strengths, and weaknesses.
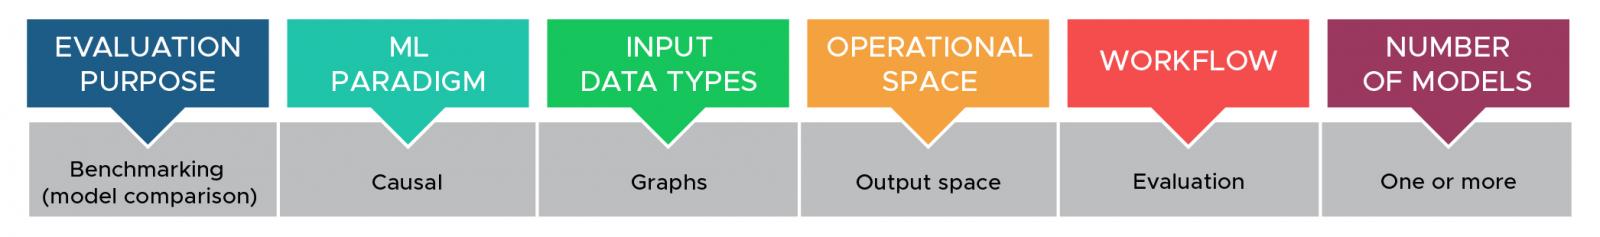
Causal Inference Validation
This tool facilitates feedback loops whereby an analyst compares proposed graphs from multiple algorithms (or ensembles) and then uses insights from the comparison to refine parameters and inputs to the algorithms.
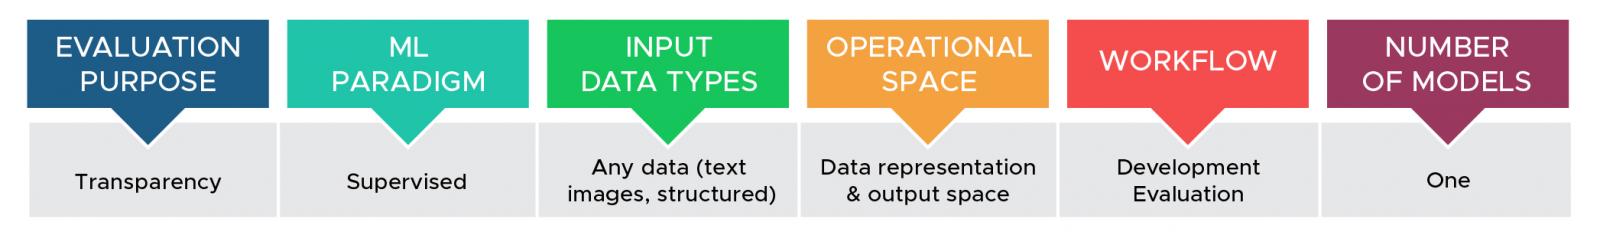
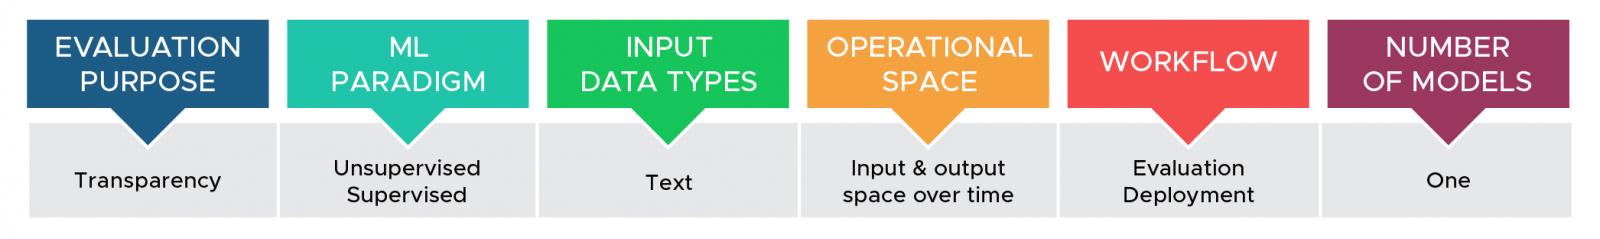
TExplore
TExplore supports interactive exploratory analysis of text-based predictive models and datasets across temporal or ordered categorical axes to enable transparency in model understanding and to identify biases or points of failure using data inputs and model predictions. Identifying biases and explaining the behavior of text-based models, or the datasets on which they are developed or evaluated, is critical for transparent evaluations of datasets and model behavior in development, evaluation, and post-deployment monitoring.
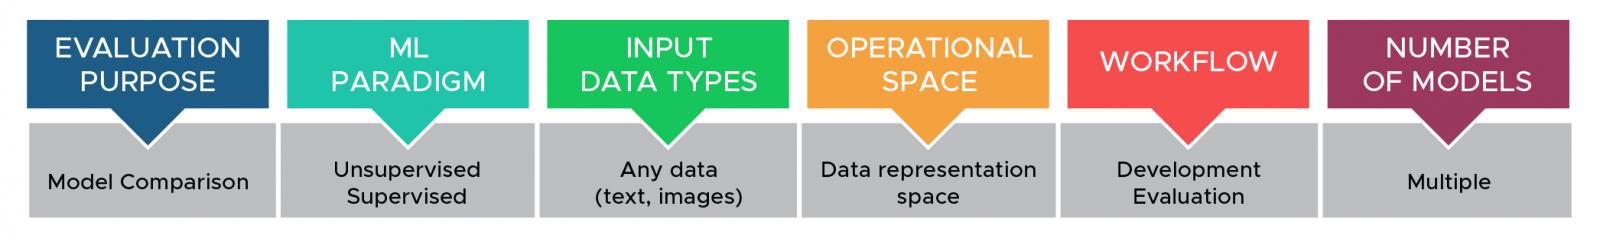
Parallel Embeddings
Whereas most model comparison is in the form of benchmarking and occurs in the model output space, Parallel Embeddings compares models based on their learned semantic representation. This visualization technique is designed to allow data scientists to understand qualitative differences in how models interpret the same input data. We have applied Parallel Embeddings to image and text data; the technique can compare the same model after different lengths of training or two architecturally distinct models.
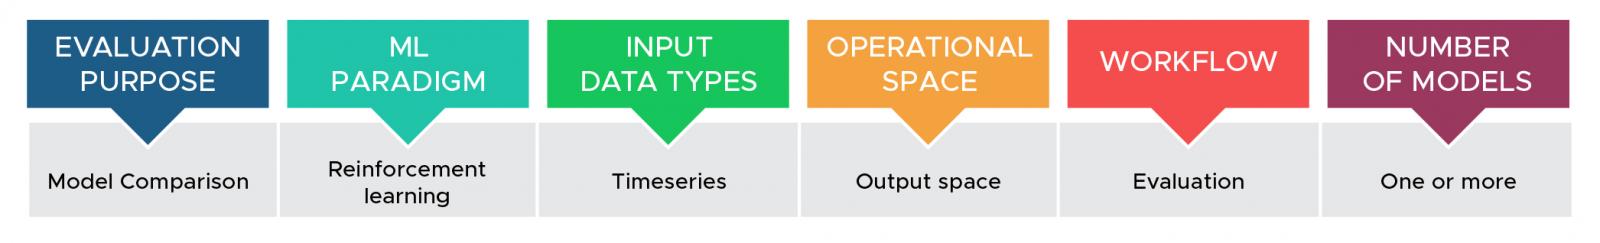
ReLVis
ReLVis is a visual analytics tool designed to help data scientists maintain situation awareness during reinforcement learning experimentation. The tool allows users to understand which hyper-parameter values lead to better or worse outcomes, what behaviors are associated with high and low reward, and how behaviors evolve throughout training.
GenX
GenX is a tool designed to facilitate in-depth comparison between and exploration of two text corpora. It works by identifying documents that are similar and then highlighting identical or near-identical passages in those documents. The tool is useful, for example, in identifying contamination in train/test splits or for identifying memorization in domain condition natural language generation models.

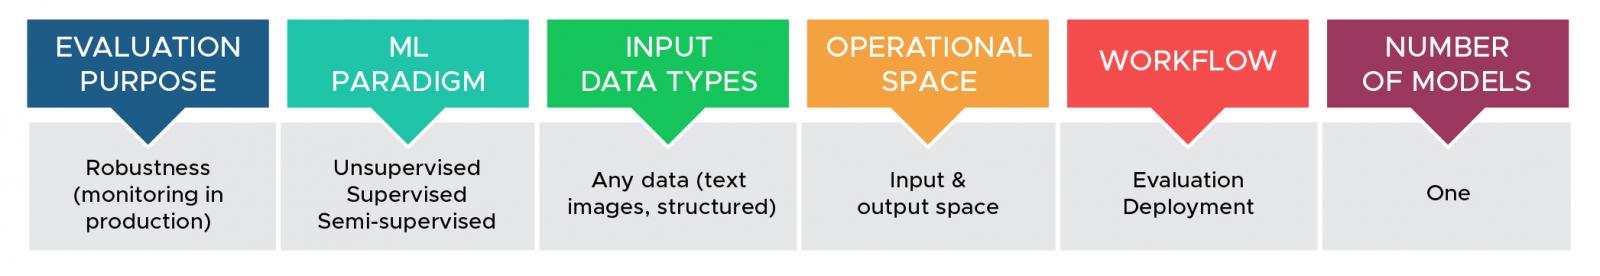
Operational Validation
Understanding model performance in an operational setting is challenging because of the presence of unlabeled data and domain shift. The Operational Validation tool addresses these challenges by allowing users to annotate a small amount of data and then see an estimation of the actual model performance compared to the predicted classes for the full unlabeled dataset.
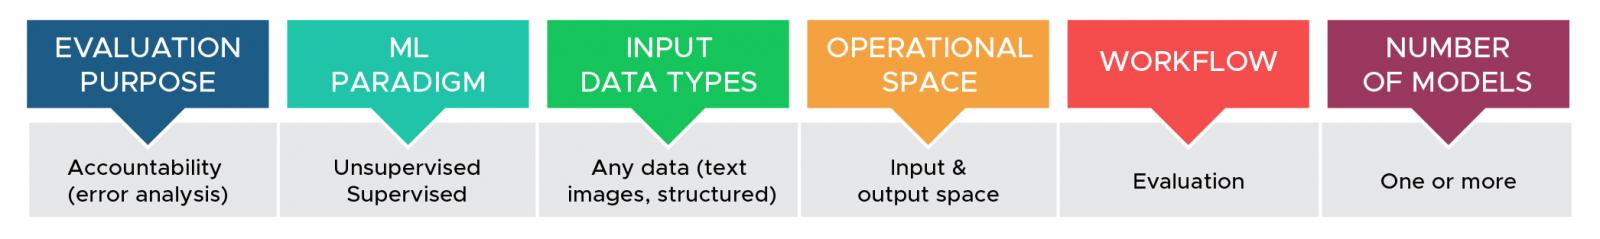
Causal Explanations
The interactive Causal Explanations tool enables users to explore and identify biased or unreliable models using causal relationships discovered from model inputs, metadata, or model properties to outputs, recommendations, or model behavior.

Escape Routes
Escape Routes is a machine learning example-based local explanation approach. It identifies training examples relevant to a given classifier input by finding the shortest paths connecting the input to training examples with a different classification than the input. The instances on these shortest paths can be presented using different layouts—grids, trees, and graphs.