A flux plane software utility called rtFlux was developed as a Microsoft Excel-based pre- and post-processor for a RT3D simulation. The tool provides a method for the user to determine the mass flow of chemical species across one or more grid-orthogonal planes over time. Mass flow results are presented as time series plots and as plots showing the spatial distribution of the relative mass flow terms for a given plane.
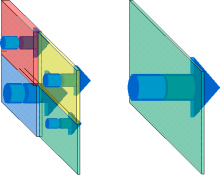
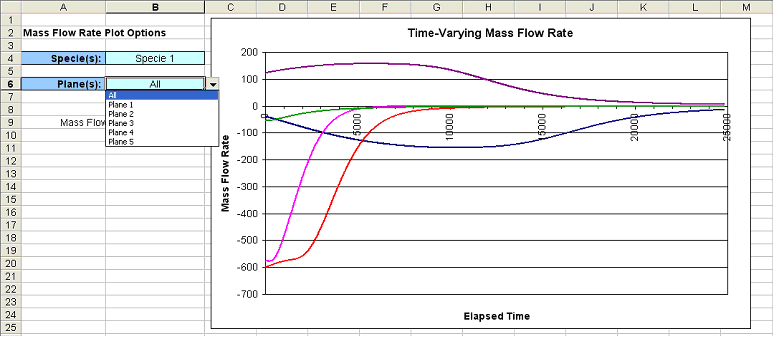
Flux planes of interest are defined as rectangular regions that are orthogonal to the model grid (i.e., the plane is aligned parallel to a row, column, or layer of the model grid). The pre-processing step incorporates the flux plane definitions into the RT3D input files. After running RT3D, the output files are processed by the utility to generate three graphs that describe the mass flux across the plane. The first plot shows the time-varying mass flow rate (e.g., kg/day) of each chemical species passing through one of the defined planes. The second plot depicts the cumulative mass that has passed through a plane over time. The third plot generated from the rtFlux utility is a bubble plot depicting the relative volumetric flow rate, species concentration, or mass flow rate through a plane at each grid cell in the plane. This bubble plot shows the location where the highest mass flux impacts occur, whether due to high volumetric flow rate or a high concentration (or combination of both).
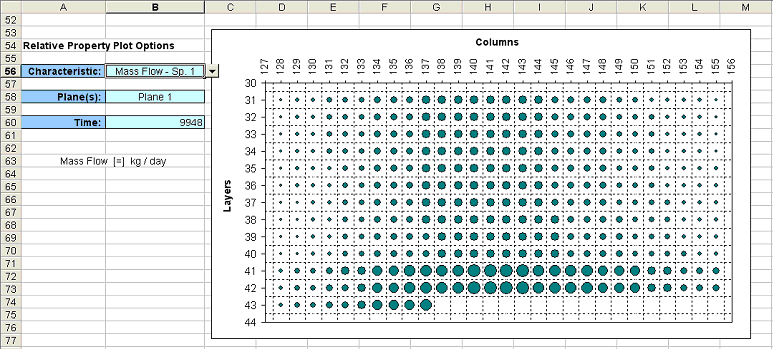
The bubble plots are convenient for assessing the spatial distribution of volumetric flow, concentration, and mass flow within a plane. The figure below shows an example of bubble plots for all three parameters. Based on the plot of flow (top left), there is a confining unit at the top of the plane and there is a higher permeability unit at the bottom. Concentration is coming through the center plane, with a relatively even distribution with depth. Thus, the mass flux is highest at the bottom center where the high concentration and high flow rate intersect.
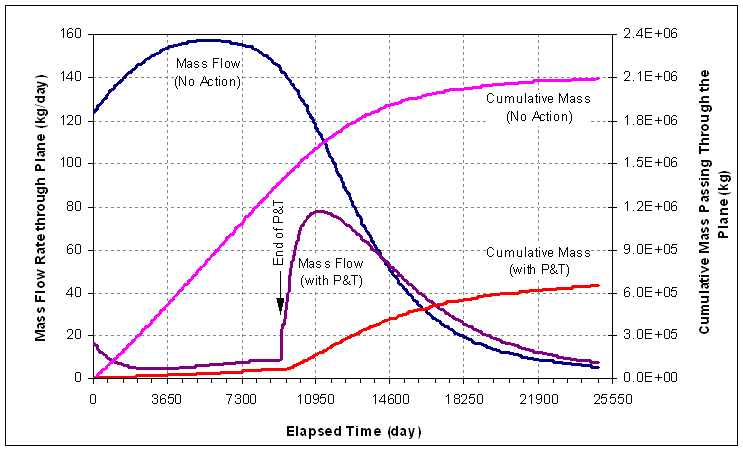
The rtFlux utility can provide the information to compare two remediation scenarios. For example, a user could evaluate natural attenuation processes (no active remediation) versus installation of a pump-and-treat (P&T) system to intercept the bulk of the contaminant plume. In this example, the P&T system is operated for 25.5 years, then the residual plume is allowed to naturally attenuate. The plot of mass flow and cumulative mass across a plane of interest shows the impact of the P&T system in reducing the mass flow and the total mass of contaminant that must be dealt with via natural attenuation processes.
The rtFlux software is available on the downloads page. The rtFlux documentation discusses how to install and use the rtFlux software, the calculations that are performed, and gives some examples of the application of the rtFlux utility. Note that while designed for use with RT3D, the rtFlux utility can also be used with MT3DMS simulations (with a simple change of select output file names).