PNNL aggregated water and energy data for various economic sectors at the county level throughout the United States for 2015, the most recent year available for comprehensive county-level water data, and developed maps and visuals of energy and water use and intensities. Economic sectors include agriculture, commercial, electricity generation, industrial, mining, public water supply, residential, transportation, and wastewater treatment.
These visuals offer valuable insight into water and energy dependencies across sectors, regions, and applications. See a complete set of visuals in the report, Water & Energy Interdependencies Across Economic Sectors of the United States.
Sample figures are shown below. Similar maps are included in the report for each economic sector.


Water-Energy Sankey Diagrams
Sankey diagrams provide a visual representation of processes and transfers within a given system, shown as proportional flows. For the Water Power Resilience Project, Sankey diagrams have been developed to show the dependencies and connections between the water and energy sectors at the aggregate US level and for each major US electricity interconnection.
By visualizing these systems through Sankey diagrams, we can (1) provide informed high-level energy and water dependency insights and (2) investigate the relative intensities between the water and energy sectors. Each of these outcomes will help support other analyses across the Water Power Resilience Project.
US Water-Energy Sankey Diagram
As climate change impacts become increasingly severe, it is critical to have a comprehensive understanding of interactions between climate, energy, and water. Here we provide a visualization of the relative energy-water interdependencies across multiple sectors across the United States.

Citation: Mongird, K., J.S. Homer, K. Oikonomou, and J.S. Rice. 2023. “Water and Energy in the United States.” PNNL-SA-187236. Richland, WA: Pacific Northwest National Laboratory.
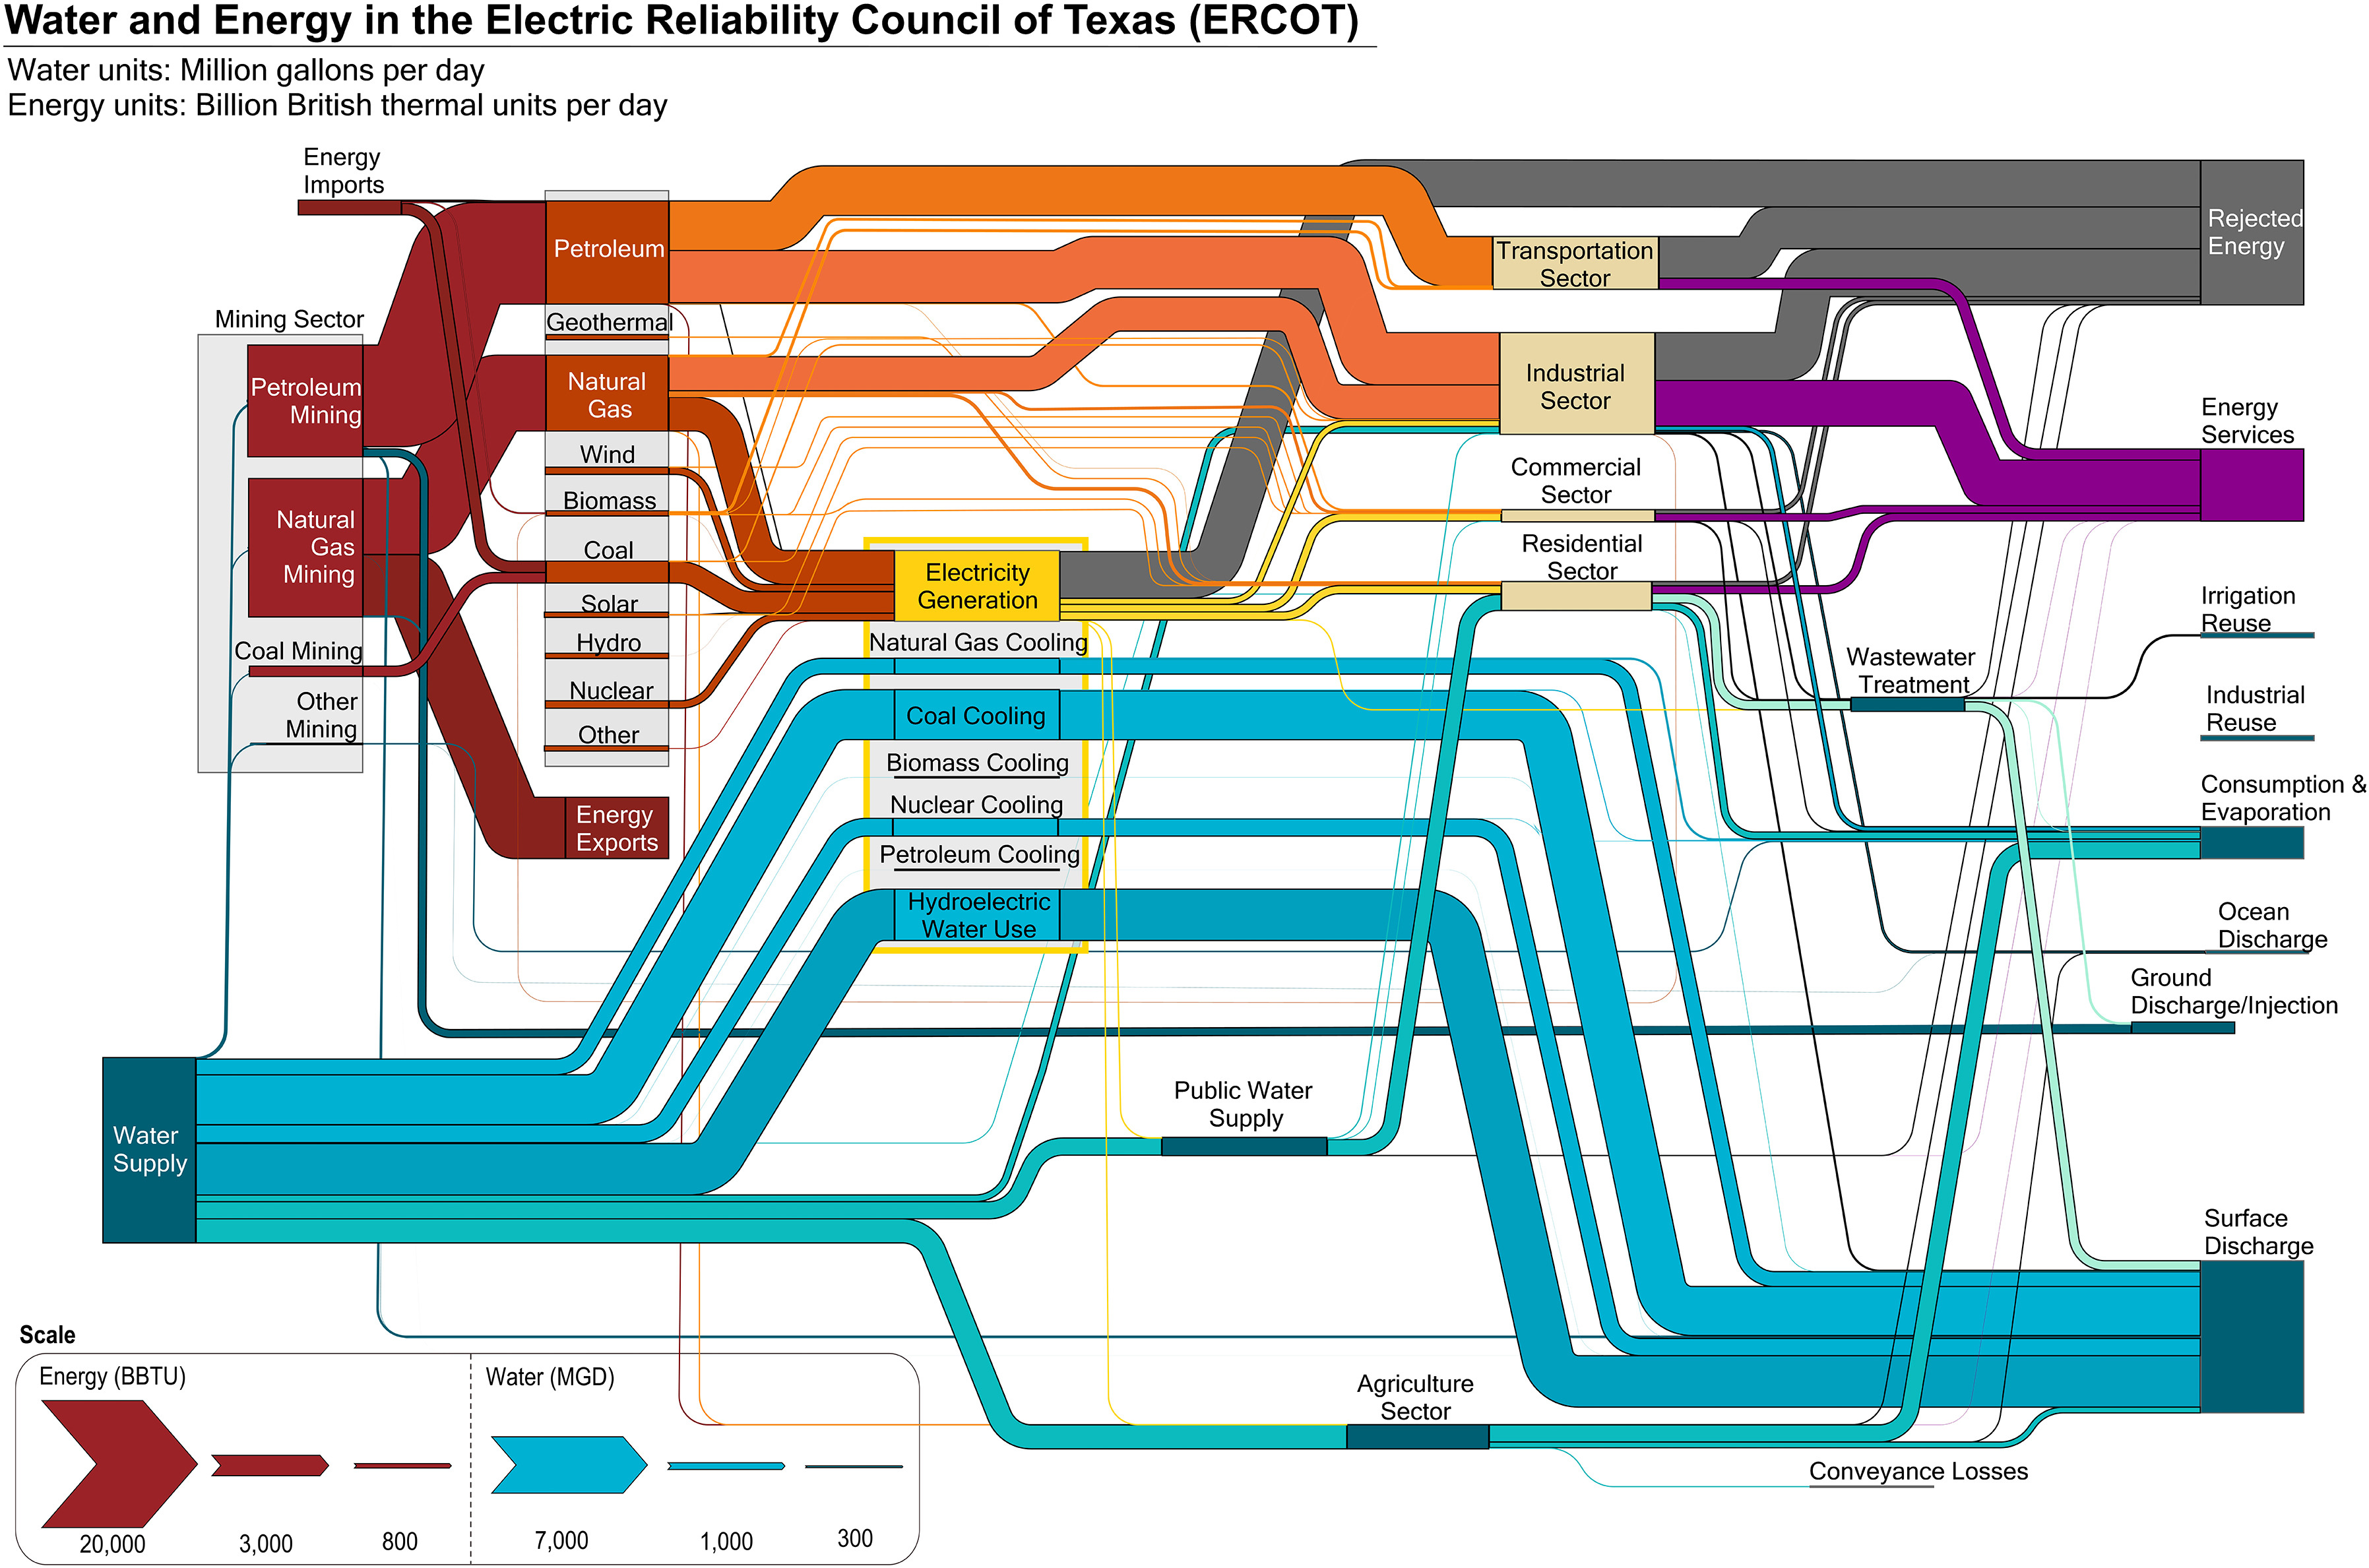
We use a multi-sectoral energy-water Sankey diagram to provide a visualization of the proportional energy and water flows across various sectors, subsectors, and applications. The energy flows (average billion British Thermal Units [BTU] per day) begin on the left, in the top half of the diagram, and flow to the right and down from resource extraction to sectoral use and ending with rejected energy or energy services. The flows of water (average million gallons per day [MGD]) originate in the bottom left-hand side and move to the right and up from water withdrawals to sectoral use and end with various types of discharges/losses. Hydropower water use is the only water flow whose thickness (i.e., quantity) is not shown at the same scale as the other water flows due to the substantial difference in quantity.
Most of the flows shown in the US Sankey diagram are adapted from data in Mongird et al. (2023), which provides 2015 water-energy Sankey diagrams at the scale of the three primary US electricity interconnections. For the aggregate US Sankey diagram, various flows, particularly those related to energy, were updated from 2015 to the most recent year available. For the data sources and methodology on these updated flows, refer to the Water and Energy in the United States documentation. For the remaining flows, which correspond to 2015 data, please refer to the methodology in Mongird et al. (2023).
US Electricity Interconnection-level Sankey Diagrams
The Sankey diagrams below show water and energy flows across sectors for each of the three major US electricity interconnections for 2015. By visualizing these systems at the decision and operational boundaries of the electricity sector, we can find similarities and differences between the three electricity interconnects and investigate the relative intensities between the water and energy sectors at this scale. For information on the methodology behind each diagram, please refer to Mongird et al. (2023).
Citation: Mongird, K., Rice, J.S., Oikonomou, K., Homer, J. 2023. Energy-water interdependencies across the three major United States electric grids: A multi-sectoral analysis. Utilities Policy 85, 2023, 101673, https://doi.org/10.1016/j.jup.2023.101673.
Eastern Interconnection Water-Energy Sankey Diagram

Western Interconnection Water-Energy Sankey Diagram

Electric Reliability Council of Texas Water-Energy Sankey Diagram