Drought Impacts on Hydroelectric Power Generation in the Western United States
Drought Impacts on Hydroelectric Power Generation in the Western United States
A historical and future perspective analysis
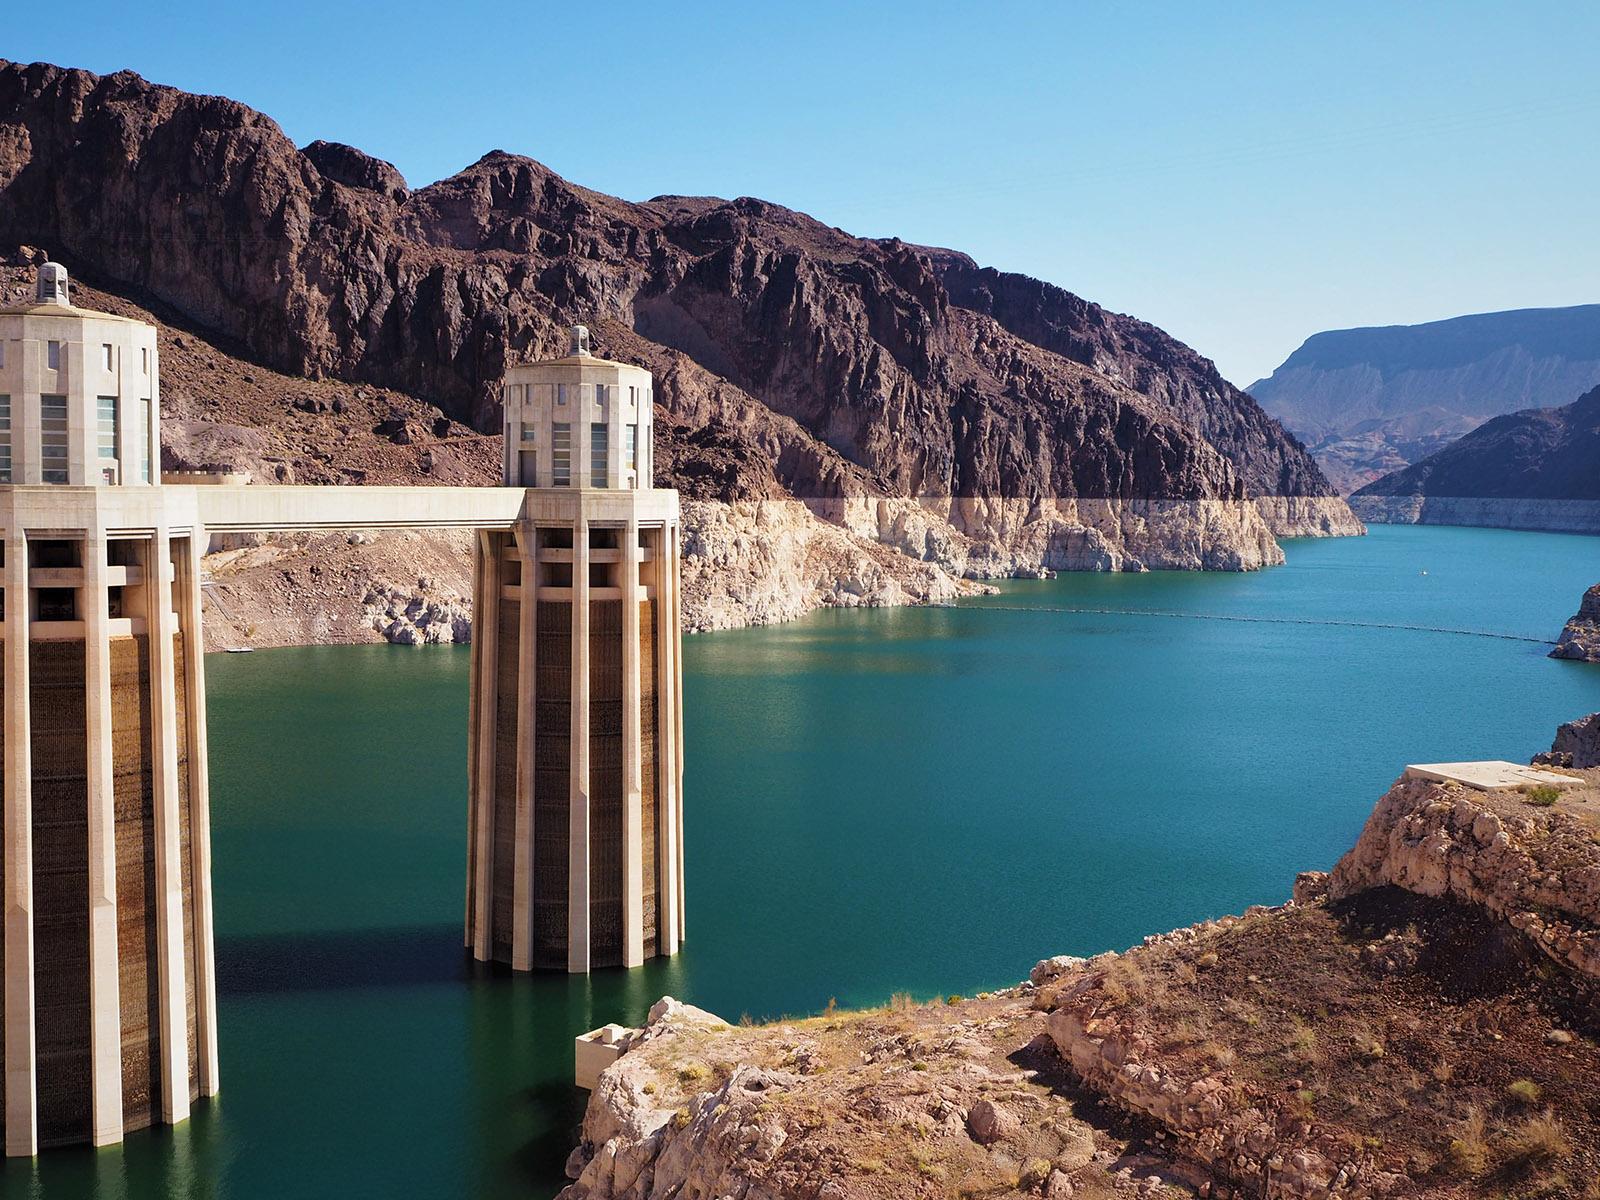
Drier conditions, such as those pictured here at Hoover Dam, could affect future hydroelectric power generation in the region.
(Photo by Katarzyna Przygodzka | Shutterstock.com)
Researchers at Pacific Northwest National Laboratory (PNNL) are working to understand the resilience of the western hydropower fleet during extreme drought. The analysis takes both a historical and future perspective of drought impacts on hydropower generation in the West.
Historical Perspective
Western Climate
There is no such thing as a normal drought. The intensity and persistence of drought varies year to year (Figure 1) and location to location (Figure 2).
 | Figure 1: Western United States monthly Palmer Drought Severity Index over the last 120 years (orange line gives smoothed trend). PDSI is a meteorological drought index based on precipitation and temperature and is used to assess the severity of dry or wet spells of weather. PSDI < -4 is often interpreted as extreme drought. (Data source: NOAA Monthly U.S. Climate Divisional Database; method described in Vose et al. [2014].) |

Hydropower in the West
There are over 600 hydropower plants broadly scattered throughout the Western United States (Figure 3). The number, size, and operations of these plants vary by region (Table 1).
 | Figure 3: Eight hydropower climate regions of the West. Each point represents a hydroelectric plant (sized by plant capacity). Points matching region color but located beyond region boundaries (see Southern California) rely on water transferred from the relevant region (e.g., plants supplied by the All-American Canal from the Lower Colorado Projects). |
Hydropower climate region | Share of western hydropower capacity | Share of western hydropower generation | Number of plants in study |
1. Mid to Upper Columbia River Basin | 44.8% | 50.9% | 55 |
2. South Cascades/California | 19.0% | 18.1% | 280 |
3. Snake River Basin | 11.7% | 11.1% | 81 |
4. Northern Cascades/Puget Sound | 10.3% | 10.0% | 73 |
5. Lower Colorado Projects | 7.6% | 5.5% | 15 |
6. Missouri Headwaters | 2.0% | 2.2% | 30 |
7. Colorado Rockies | 1.5% | 1.0% | 52 |
8. Utah Wasatch Range | 0.4% | 0.2% | 58 |
Total | 97.3% | 99.0% | 644 |
Table 1: Hydropower climate regions of the West. Generation shares are based on 2001 – 2020 net generation annual observations.
Hydropower in the West
There are over 600 hydropower plants broadly scattered throughout the Western United States (Figure 3). The number, size, and operations of these plants vary by region (Table 1).
 | Figure 4: Total hydroelectric power generation in the United States. Western states are defined as WA, OR, CA, ID, MT, UT, CO, NV, AZ, WY, and NM. Percentage values in parentheses give deviation from mean annual western generation (dashed line). (Data source: EIA state-level generation reports) |
Drought impacts look different when viewed from individual river basins. Analysis of drought impacts on basin-level generation reveals six separate worst hydro drought years in the West during the 21st century. In fact, the year-to-year variation and degree of variation differ greatly between basins (Figure 5).

For more details on this retrospective analysis, see: Turner, S. W.D., N. Voisin, K. Nelson, and V. Tidwell. 2022 “Drought impacts of hydroelectric power generation on the western United States.”
Future Perspective
Drought Impacts on Hydropower Production
Hydropower drought under a changing climate can be explored using simulations of hydropower production based on the latest climate change projections from the Intergovernmental Panel on Climate Change. These simulations account for the impact of change on the natural hydrologic cycle along with the effects of human management and use of water. They provide projections of how hydropower production may change; they do not provide forecasts of the future but rather a view of what is possible under a particular climate change scenario.
Similar to the historical period, hydropower drought with periods of low hydropower production occurs unevenly across the western United States. While low production may be seen across multiple regions, it typically does not occur across all regions at once.
Looking at the entire western United States, the year with the lowest generation across all hydropower facilities is shown in Figure 6 for the near-term future period (10 – 20 years from now). In this year, there are decreases in many regions, yet increases in a couple.

Taking a slightly different look, Figure 7 shows the projections of generation over time for each region. The years marked show the two lowest generation years as measured by total generation across the entire western United States for each future period. Again, we see that drought rarely impairs hydropower generation across all western river basins at the same time.
