December 20, 2017
Feature

See Here

New visual analytics book highlights users’ perspective

Thumbnail
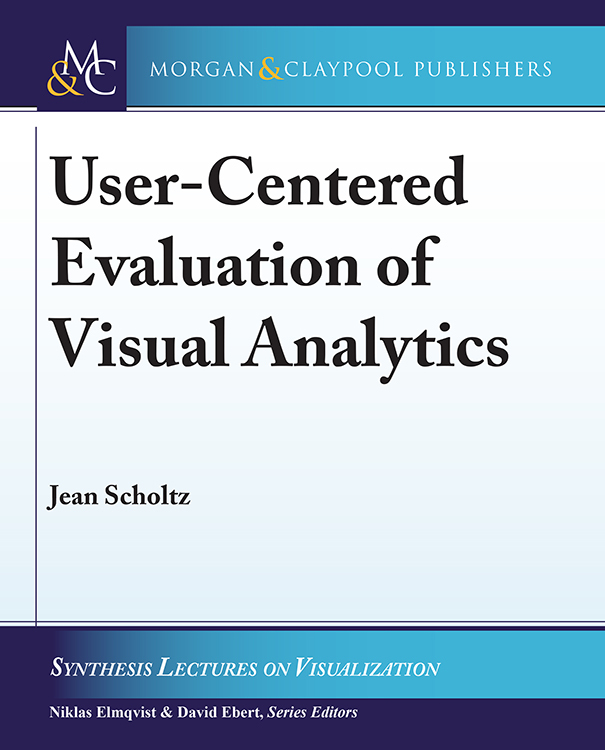
Jean Scholtz’s book on evaluating visual analytics tools gives computer experts a resource for designing effective software.

As the world continues to generate massive amounts of computerized data, visual analytics tools help make sense of it. But, how do you make these tools as effective as possible for the end users? A new book by PNNL Chief Scientist Jean Scholtz, Visual Analytics Group, is helping visual analytic researchers and developers do just that.

User-Centered Evaluation of Visual Analytics lays out best practices and trends in designing and evaluating visual analytics tools. The 83-page book was published in October 2017 by Morgan & Claypool.

Scholtz, a noted expert in user-centered evaluation, had long seen a gap between how such software tools are typically designed versus how people use them in real life.

“It’s not enough to evaluate your software to make sure it works,” she said. “You must design it based on an understanding of the end users’ tasks, data, and thinking processes.”

Thumbnail
Jean Scholtz

The book recommends enlisting domain experts, or carefully chosen surrogates, to try out various pieces of the software early in the design process. This approach can reveal, for example, whether the software uses the right metadata, whether users understand the data when they apply different filters, and how long it takes for users to comprehend a visualization when it changes. Though this process takes more time up front, it dramatically improves the end product, ultimately saving money and time, Scholtz contends.

Her book includes visual analytics case studies adapted from the intelligence and human-computer interaction communities. She also discusses trends in visual analytics that will affect the functionality, and hence the evaluation, of future software. This important publication reinforces PNNL’s nationally recognized leadership in the field of visual analytics.

Reference:
Scholtz J. 2017. “User-Centered Evaluation of Visual Analytics.” Synthesis Lectures on Visualization Series 5(1):i-71. DOI: 10.2200/S00797ED1V01Y201709VIS009.

Key Capabilities

###

About PNNL

Pacific Northwest National Laboratory draws on its distinguishing strengths in chemistry, Earth sciences, biology and data science to advance scientific knowledge and address challenges in sustainable energy and national security. Founded in 1965, PNNL is operated by Battelle for the Department of Energy’s Office of Science, which is the single largest supporter of basic research in the physical sciences in the United States. DOE’s Office of Science is working to address some of the most pressing challenges of our time. For more information, visit https://energy.gov/science. For more information on PNNL, visit PNNL's News Center. Follow us on Twitter, Facebook, LinkedIn and Instagram.
Published: December 20, 2017