September 8, 2020
Feature

PNNL Team Taps Twitter to Explore Perspectives on COVID-19 Response

Scientists tackle millions of tweets to offer state-by-state perspective

Data center

© Ton Snoei  | Shutter Stock

It’s easy to get a read on one person’s perspective by checking out their social media posts. But an entire nation?

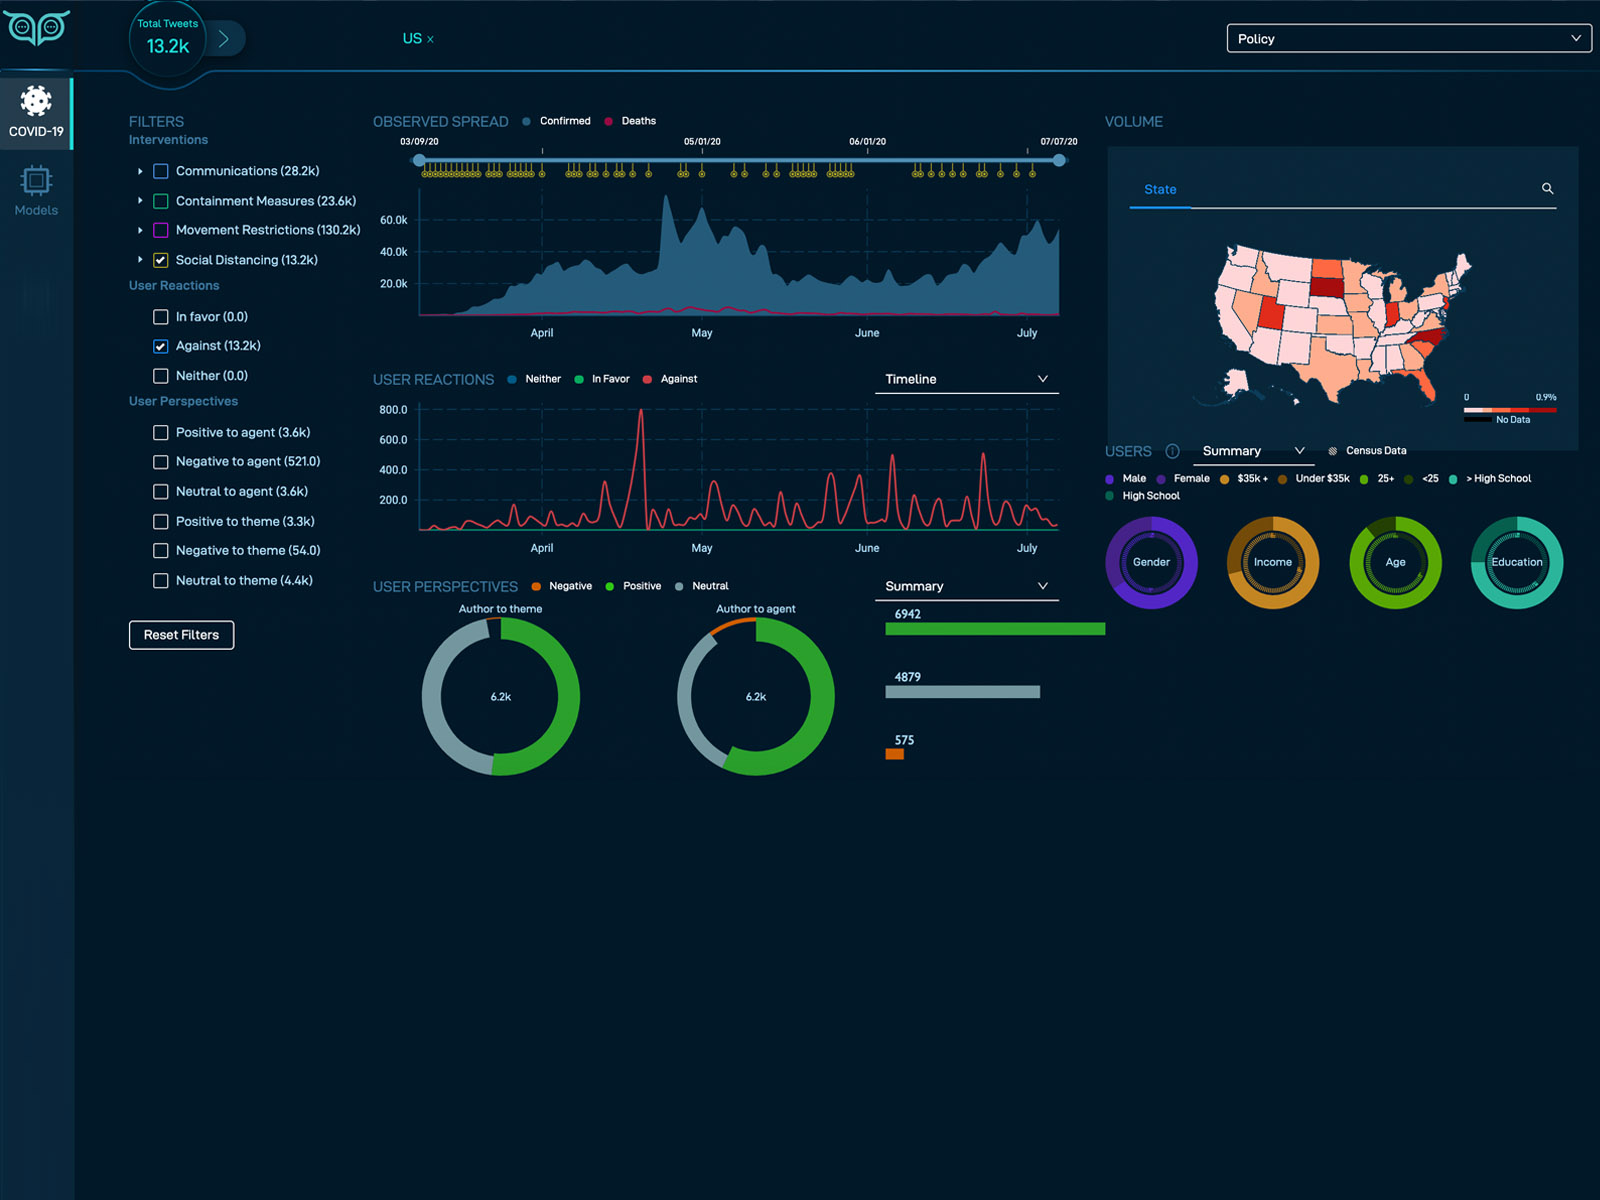
That’s what scientists at Pacific Northwest National Laboratory are doing when it comes to the United States and COVID-19. The team is using a tool called WatchOwl to collect more than 4 million tweets per day related to the pandemic. The tool then identifies and analyzes tweets related to interventions like social distancing and movement restrictions.

So far, WatchOwl includes over 5.5 million posts related to COVID-19 non-pharmaceutical interventions during a four-month span, March 7 through July 7. The team plans to bring the analysis up to date within a month. The tool is available to the public at watchowl.pnnl.gov.

Language reflects attitudes

WatchOwl uses natural language processing and deep learning analytics to tag posts as positive, negative, or neutral and to extract from the posts fine-grained user reactions like elaboration or disagreement. The majority of posts related to COVID-19 are neutral. For example, if a new masking requirement goes into effect in a specific state, many of the posts simply mention or repeat the new rules. But a few posts definitely posit a strong positive or negative interpretation.

“The language that you use reveals a great deal about you and your behavior,” said Svitlana Volkova, the leading scientist on the project, who specializes in machine learning and natural language processing. “And as a nation, the language our citizens use to describe their reactions and attitudes to current events reveals public perspectives – key information for policy-makers and others as they confront this pandemic.”

Watch Owl Screen Shot
These two screen shots illustrate the power of WatchOwl. The image above is a snapshot of negative sentiment toward social distancing; South Dakota and North Carolina stand out most strongly.
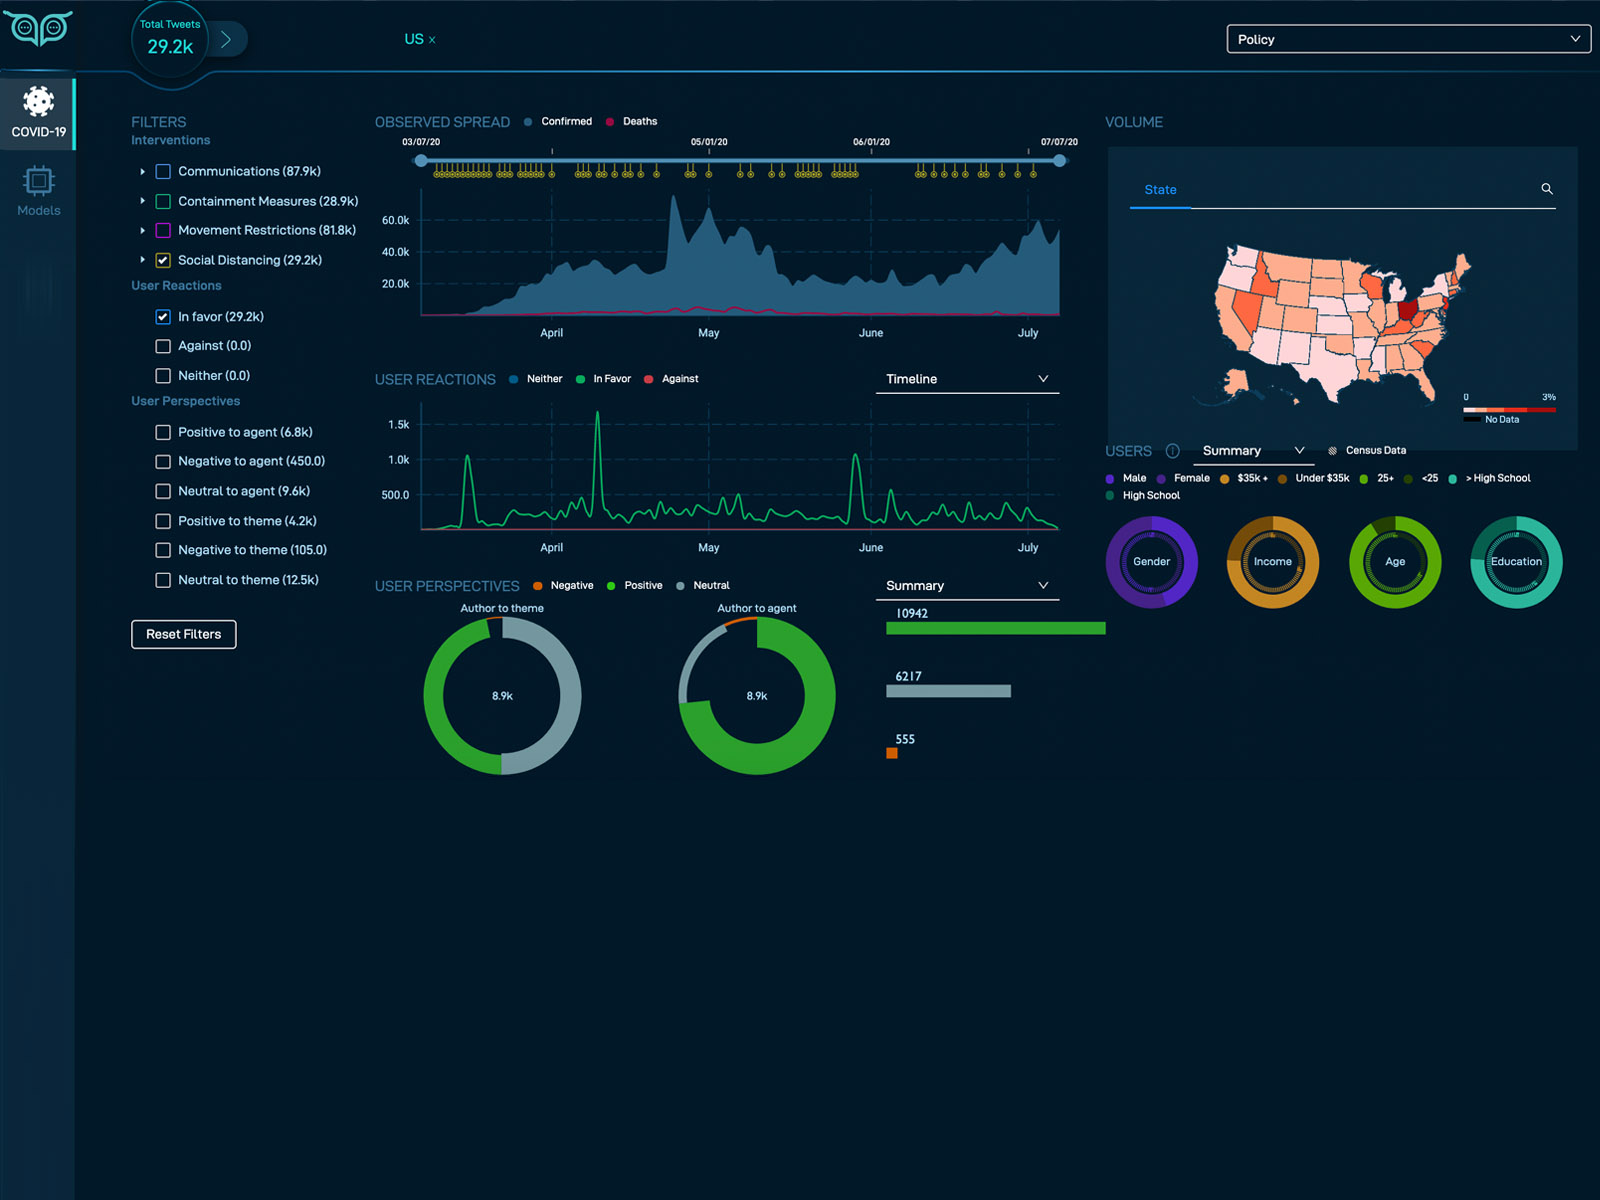
The image below is a snapshot of positive sentiment around the same issue; Ohio stands out.
Screen shot WO 3

The team’s data set is built upon publicly available tweets. The information is organized state by state; the data anonymizes users but includes inferred information on users’ age, education, income, and gender alongside census estimations. Researchers also integrate daily statistics of the spread of COVID-19 and state-level policy announcements from the National Governors Association State Action Tracker. This combination allows the team to perform analyses in the context of the spread of disease and the timing of policies implemented within states.

“Although Twitter is not representative, it still provides a valuable insight into public perspectives towards different policies,” said Maria Glenski, the co-leading scientist on the team, who specializes in modeling and explaining complex social behavior. “Coupling this data, which comes directly from users, with other rich datasets gives us a unique view into the public’s reaction to the nation’s pandemic response.”

Among the interventions about which researchers explored social media reactions:

  • Formal communications, such as health department recommendations or government declarations;
  • Containment measures, like self-quarantines;
  • Movement restrictions, like shelter-in-place orders;
  • Social distancing guidelines, including limits on large gatherings and business closures.

Some of the early findings bring no surprise. For example, social media posts about the pandemic have been most prevalent in states that have been most affected, including New York, California, and Florida.

Currently, the team is exploring what type of post generates the most discussion, which posts are most engaging to the broadest audiences, what type of content is linked to particular events in specific states or regions, what type of information is most likely to be the subject of disinformation, and more.

Networked Map
Credit: © Zeynur Babayev | shutterstock.com

Social media analysis addresses national challenges

The work is part of a broader research program at PNNL to analyze social media to aid the nation’s emergency response, disaster recovery, and protection of critical infrastructure. The team explores the sources of social media posts, the trustworthiness of those sources, the intent of the posts, and audience reactions and subsequent actions. The creation of WatchOwl, funded by PNNL, is the latest example where scientists have applied the body of work to a current national challenge.

Researchers are analyzing the data for trends and plan to submit a manuscript with details of its findings to an academic journal.

In addition to Glenski and Volkova, the team includes scientists Dustin Arendt, Ellyn Ayton, Kevin Cronk, Austin Golding, Yi Huang, Ryan Rabello, Emily Saldanha, and Grant Tietje.

# # #

###

About PNNL

Pacific Northwest National Laboratory draws on its distinguishing strengths in chemistry, Earth sciences, biology and data science to advance scientific knowledge and address challenges in sustainable energy and national security. Founded in 1965, PNNL is operated by Battelle for the Department of Energy’s Office of Science, which is the single largest supporter of basic research in the physical sciences in the United States. DOE’s Office of Science is working to address some of the most pressing challenges of our time. For more information, visit https://www.energy.gov/science/. For more information on PNNL, visit PNNL's News Center. Follow us on Twitter, Facebook, LinkedIn and Instagram.