August 19, 2021
Research Highlight

Revealing the Genes that Respond to Viral Infections

Hypergraphs can more faithfully identify important genes in complex immune responses

Hypergraph of a biological system

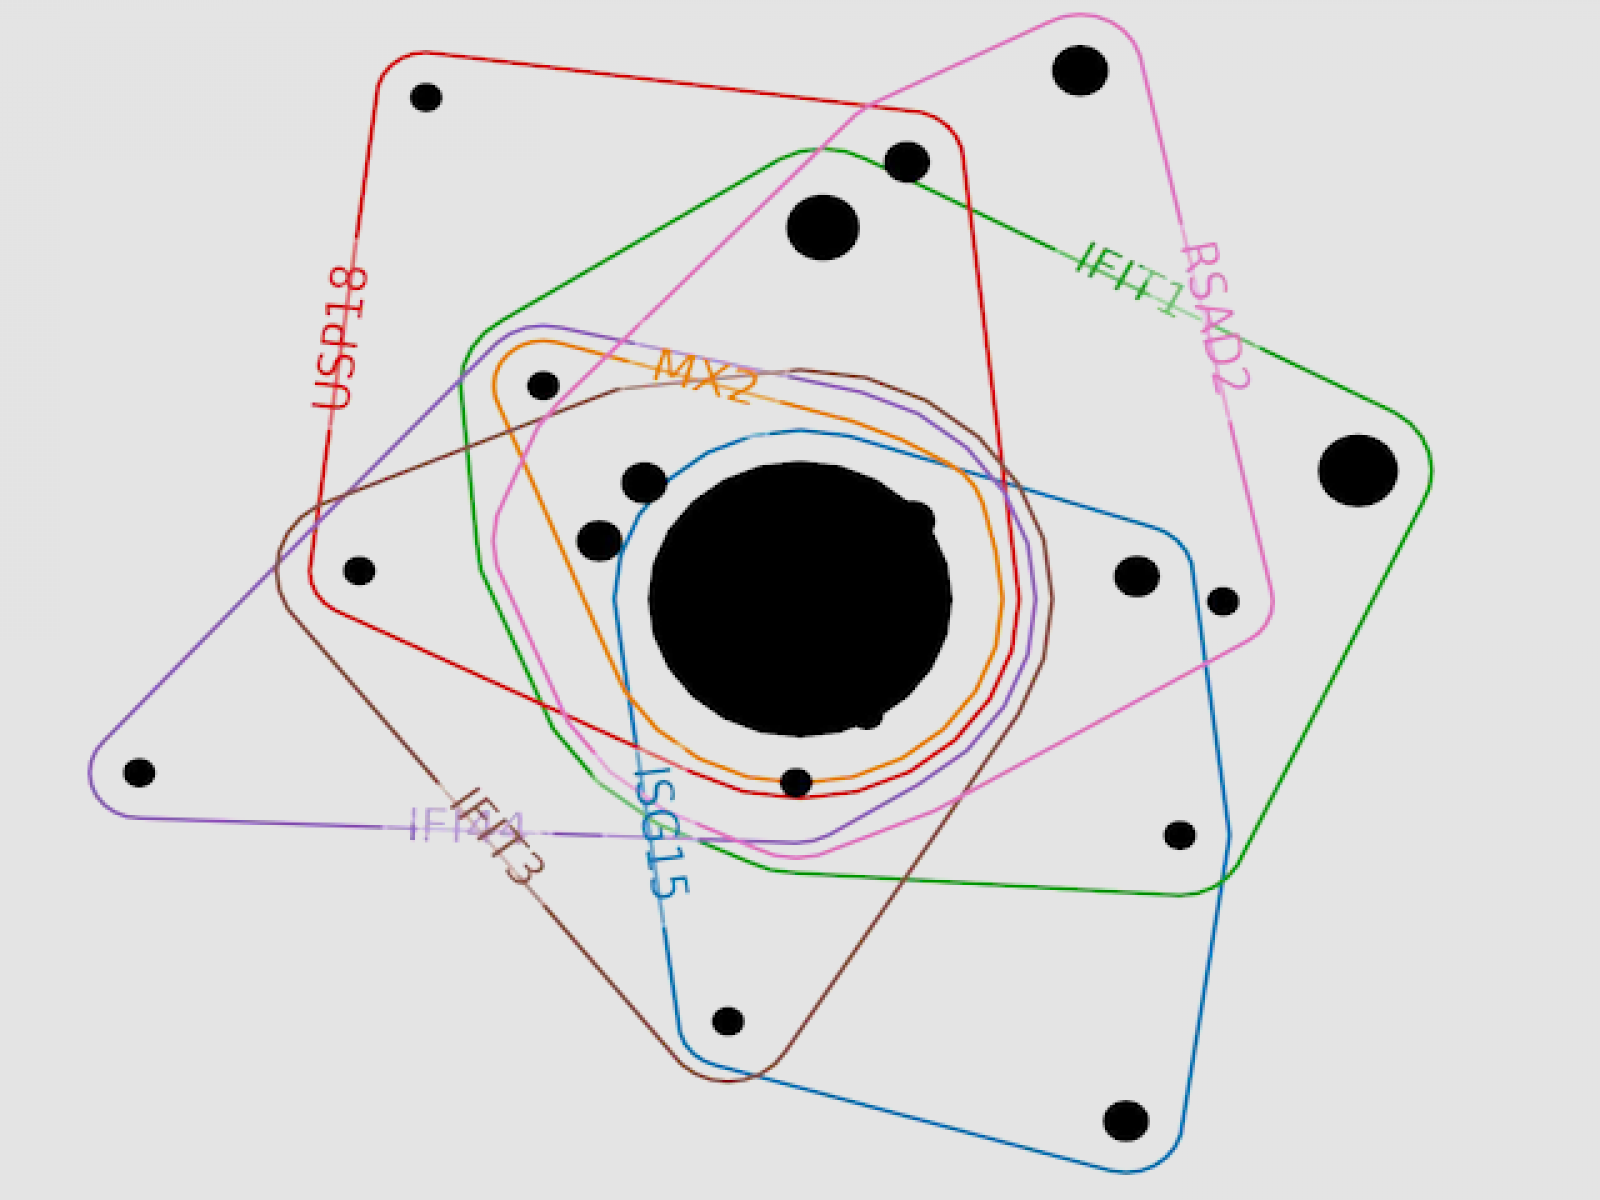
In this portion of an example hypergraph of a biological system, colored lines represent genes and encircle experimental conditions (black circles) where the gene was significant. The larger the black circle, the more experimental conditions are in that group. 

(Image courtesy of Emilie Purvine | Pacific Northwest National Laboratory)

The Science

Before researchers can create therapeutics to help the immune system fight viruses, they need to understand how genes act together to create immune responses. Graphs are frequently used to model these interactions, but because graphs can only capture interactions between pairs of genes, they cannot describe how multiple genes work in tandem to create an intricate response. Mathematicians and biologists at Pacific Northwest National Laboratory are using an advanced mathematical tool called hypergraphs to identify how human cells respond to viral infection. These multidimensional graphs identify and rank the activity of genes as they team up to fight against viruses, creating a more precise understanding of the properties of these complicated pathways.

The Impact

Because genes rarely are expressed alone or just in pairs, PNNL’s method captures the native complexity of biology to get a more accurate representation of the relationships between genes and immune responses. With further research, the genes the researchers identified as most central to the immune response could become targets for developing medicines to treat viruses.

Summary

To create their hypergraphs, the PNNL researchers used ten years of data from gene expression, protein expression, and signaling molecules in human cells infected with viruses including influenza, Zika, Ebola, and coronaviruses. Previous approaches using graphs had identified relationships between two molecules at a time in the data, but in this study the PNNL researchers categorized connections among many molecules, not just pairs, to form a hypergraph. Those connections quickly tangled into complex systems representing molecular networks that keep cells functioning.

The researchers analyze the structure and shape of their hypergraph systems, looking for meaningful patterns that indicate molecular components with key roles. Genes or proteins involved in these central connections act like bridges to keep information flowing between different parts of the network, likely keeping an entire cell functioning properly. Hypergraphs model when genes are co-expressed across a variety of samples. Because of this, the patterns and connections they reveal match observed data—and therefore real system behavior—more closely than simpler graph-based methods.

Published: August 19, 2021

Feng, S., Heath, E., Jefferson, B. et al. Hypergraph models of biological networks to identify genes critical to pathogenic viral responseBMC Bioinformatics 22, 287 (2021). https://doi.org/10.1186/s12859-021-04197-2