Got Omics Data? We Have an App for That
New apps help researchers with statistical analyses of data
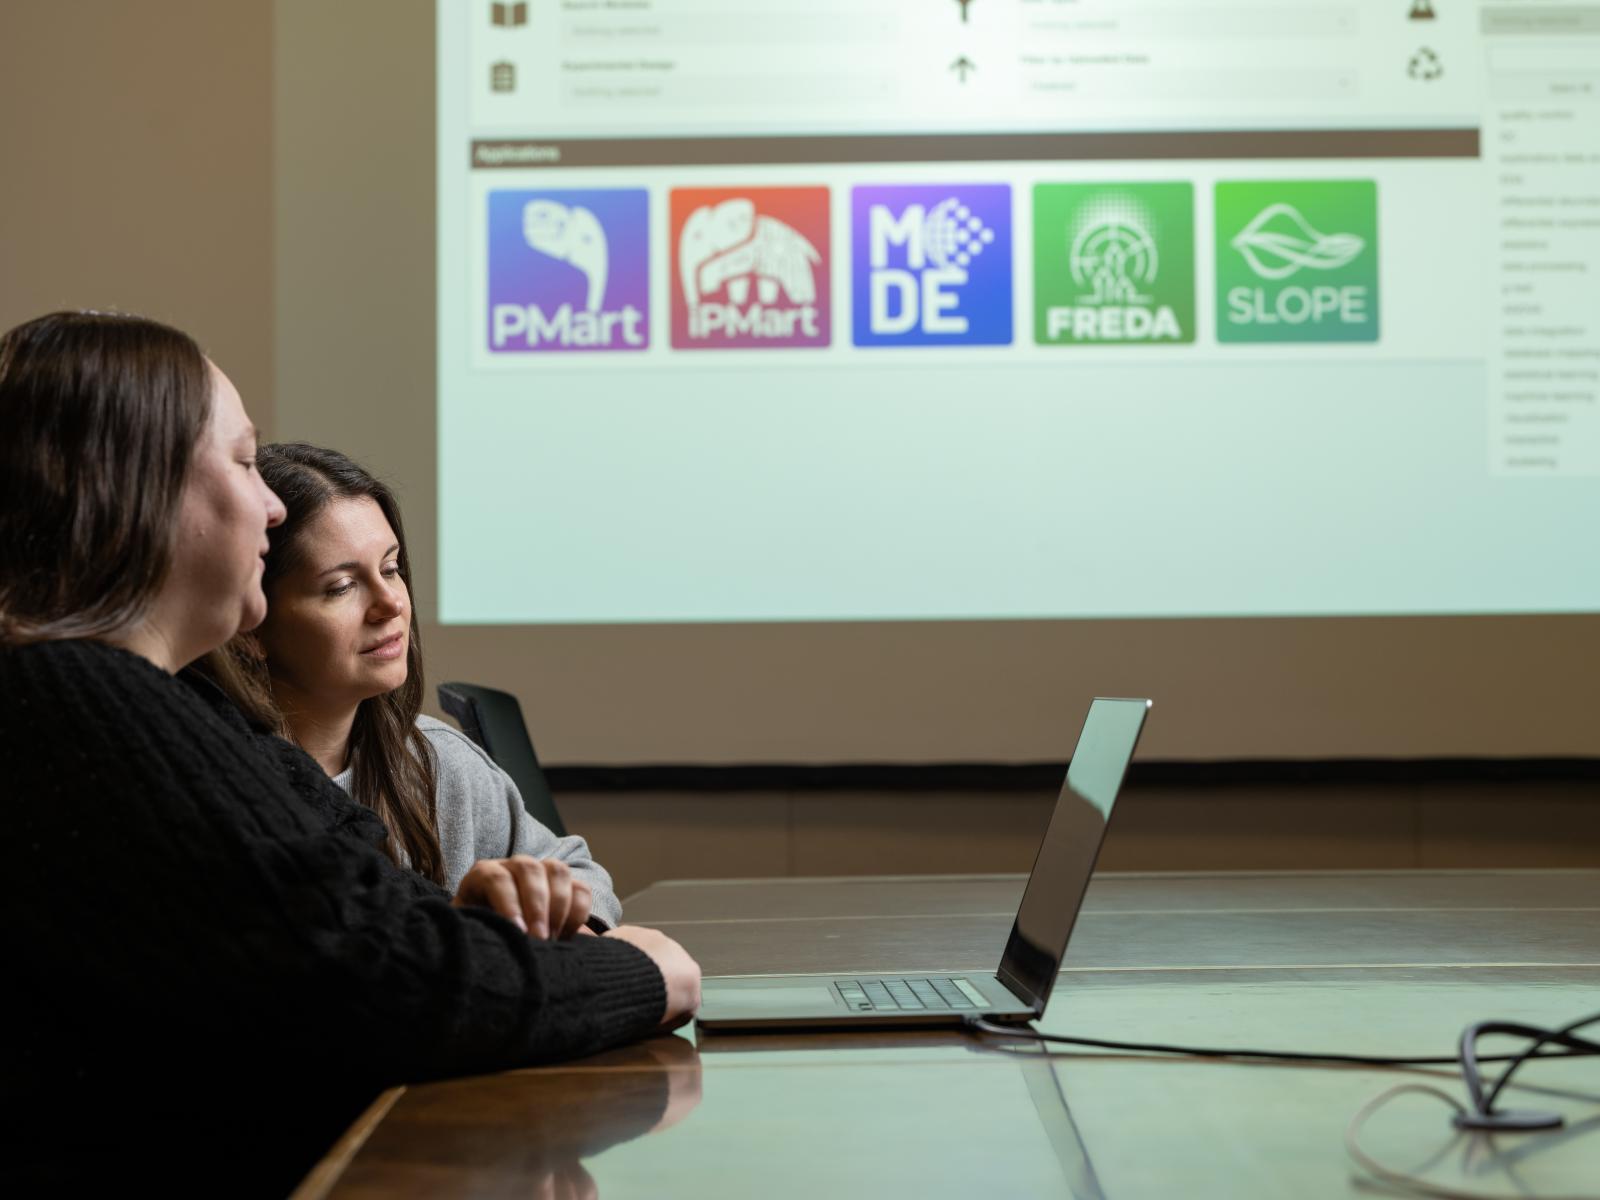
Lisa Bramer and Kelly Stratton created the Multi-Omics Analysis Portal (MAP) to help researchers analyze their data.
(Photo by Andrea Starr | Pacific Northwest National Laboratory)
It’s a sign of the times: an app store for omics enthusiasts.
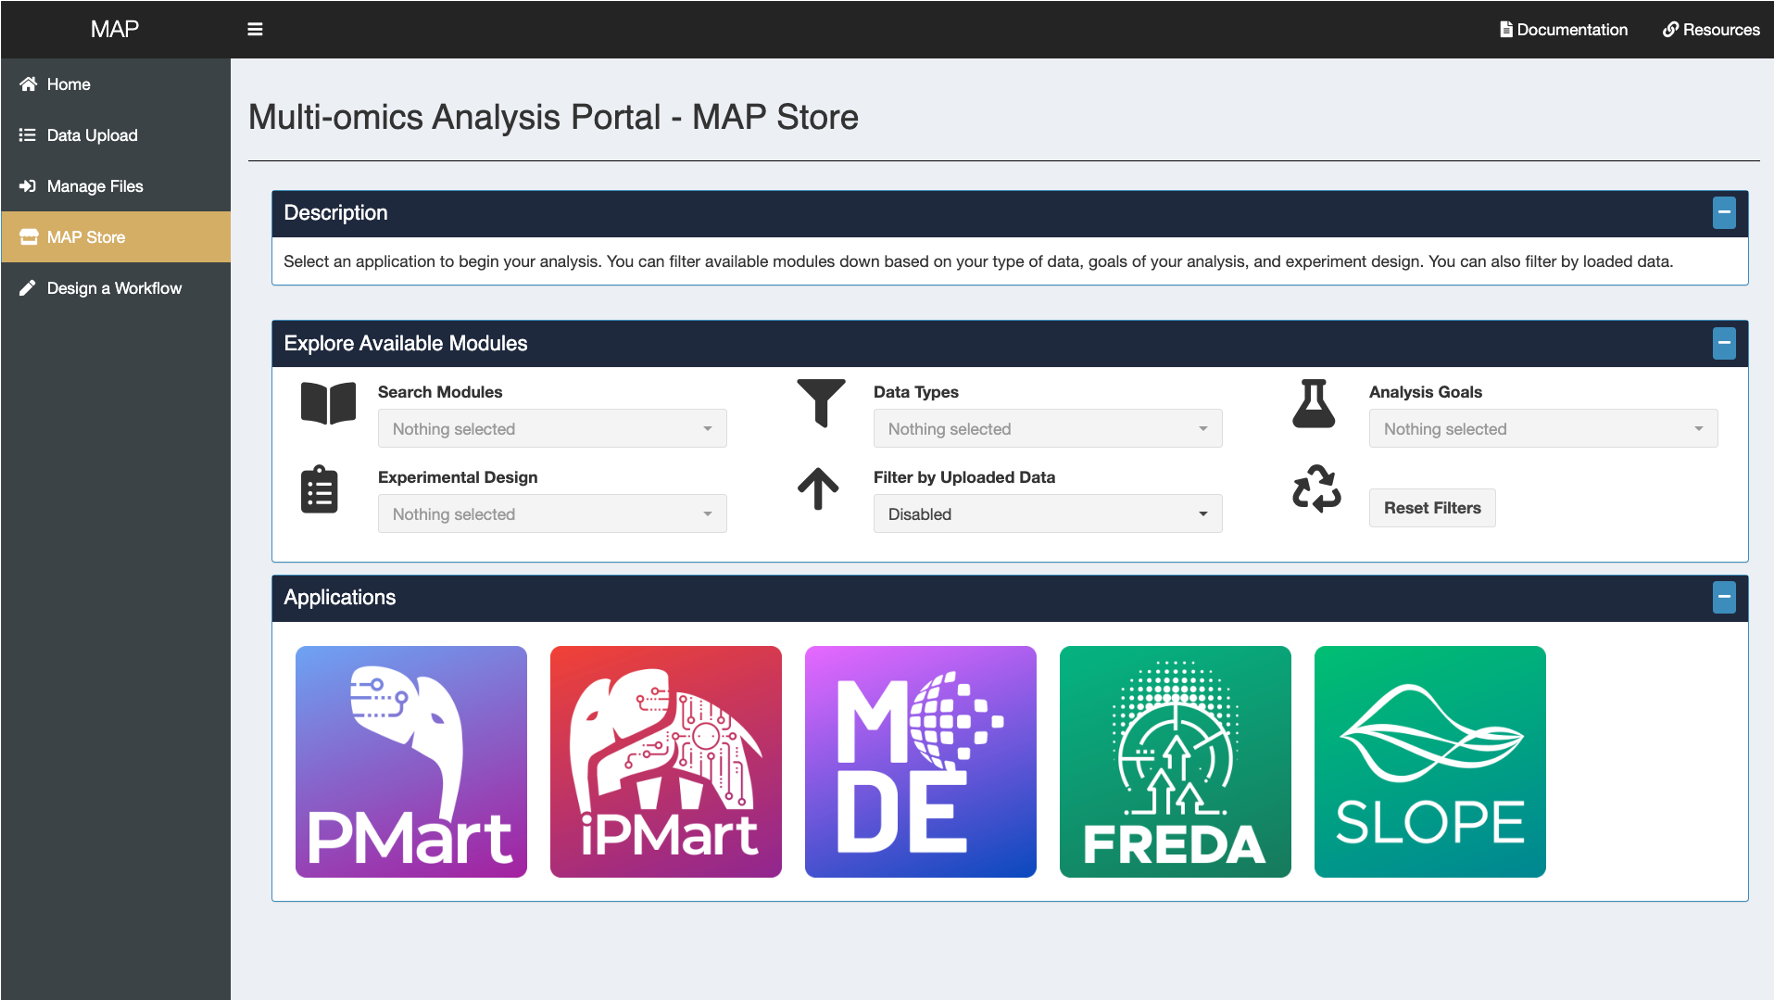
The Multi-Omics Analysis Portal (MAP) by the end of 2024 will be a one-stop shop for computer applications capable of making sense of various and vast omics data. Genomics, proteomics, lipidomics, transcriptomics—all are welcome.
Data scientist Lisa Bramer and biostatistician Kelly Stratton, of the Pacific Northwest National Laboratory (PNNL) and the Environmental Molecular Sciences Laboratory, started developing the store a few years ago. The team has released beta versions of two applications so far, and they anticipate adding four more by the end of the year.
“We’re trying to create something approachable yet scalable,” said Bramer. “The goal is to not add capabilities into a single oversized app every time we need to incorporate a new tool, new instrument, or new technique. Instead, we can create these smaller, more bite-sized apps and put them all in one place so researchers can more easily get their hands on data early and often.”
Sneha Couvillion, a biomedical researcher at PNNL, is an early adopter and fan of the MAP store.
“I love it. It’s a great tool for a non-statistician like me to do basic statistical analysis on your data,” said Couvillion. It has been especially helpful, she says, for smaller studies where she wants a quick look at the data before deciding how to proceed.
In academia, she adds, “…having a team of biostatisticians is not typical. That’s a luxury we have at PNNL.” But even with a team of them, she says, the queue for data analysis can get backed up. With MAP and its apps, researchers can now dive into the data on their own, as often as they want. If they require additional analyses, they can bring in a biostatistician to help.
“It’s a process improvement, in addition to being a suite of tools,” says Bramer. “Typically, experiments would go from design to benchtop to instruments to data analysis, with the researcher not seeing the data until a biostatistician could go over it with them.”
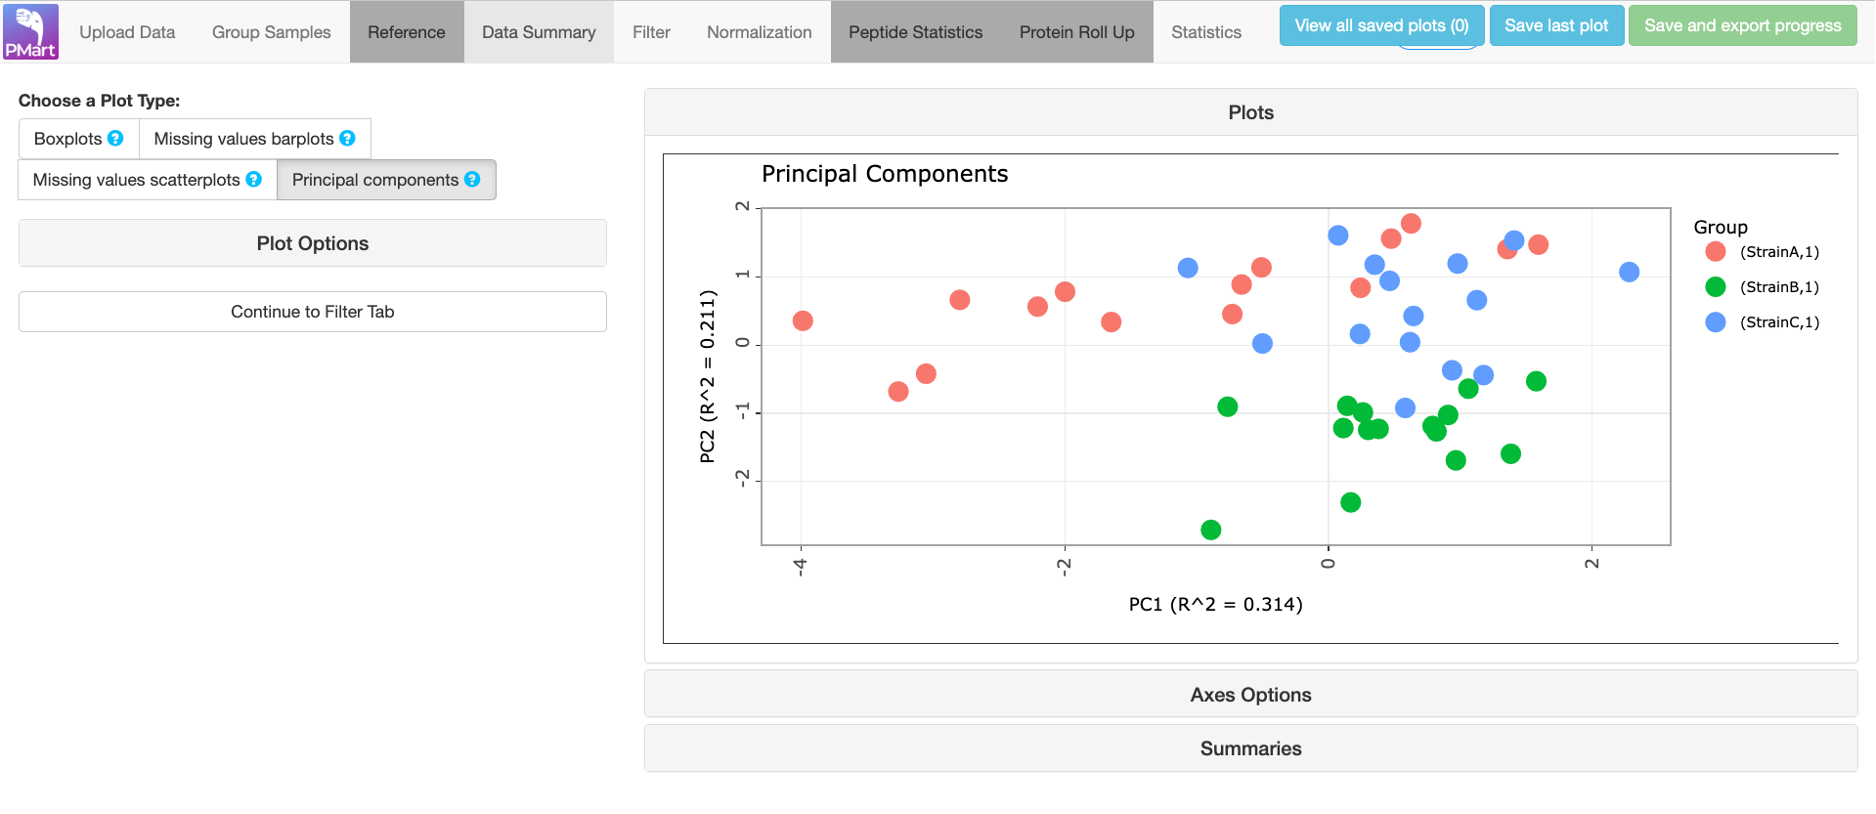
With PMart, one of the apps in MAP, it takes Couvillion only half an hour to go from raw data to final stats with a simple dataset. This allows her to mull over the information and decide the next steps—usually progressing to a much bigger experiment that is more tightly designed thanks to the initial data.
A Two-Fer
Over the years, visualization has been an important addition to data analysis. Some people thrive on lists or rows of text while others prefer pictures. Before visualization, the latter were up a creek and (likely) had a more difficult time making sense of their data.
The PMart tool, initially created with funding from the National Cancer Institute for analysis of cancer proteomics data, was expanded to process general omics and additional data types with support from PNNL’s Laboratory Directed Research and Development Program. The tool now performs quality control and prepares data for statistical comparisons. It also includes handy summary visualizations—all of which can be individually downloaded and saved for reports and even include the computational commands that a statistician can reproduce. This is especially helpful for anyone in the scientific community who uses apps in MAP but wants or needs to take the analyses a step further with an expert statistician.
Additionally, the apps can transfer data between them for additional analyses. PMart, for example, can produce data types that go into a second app known as MODE.
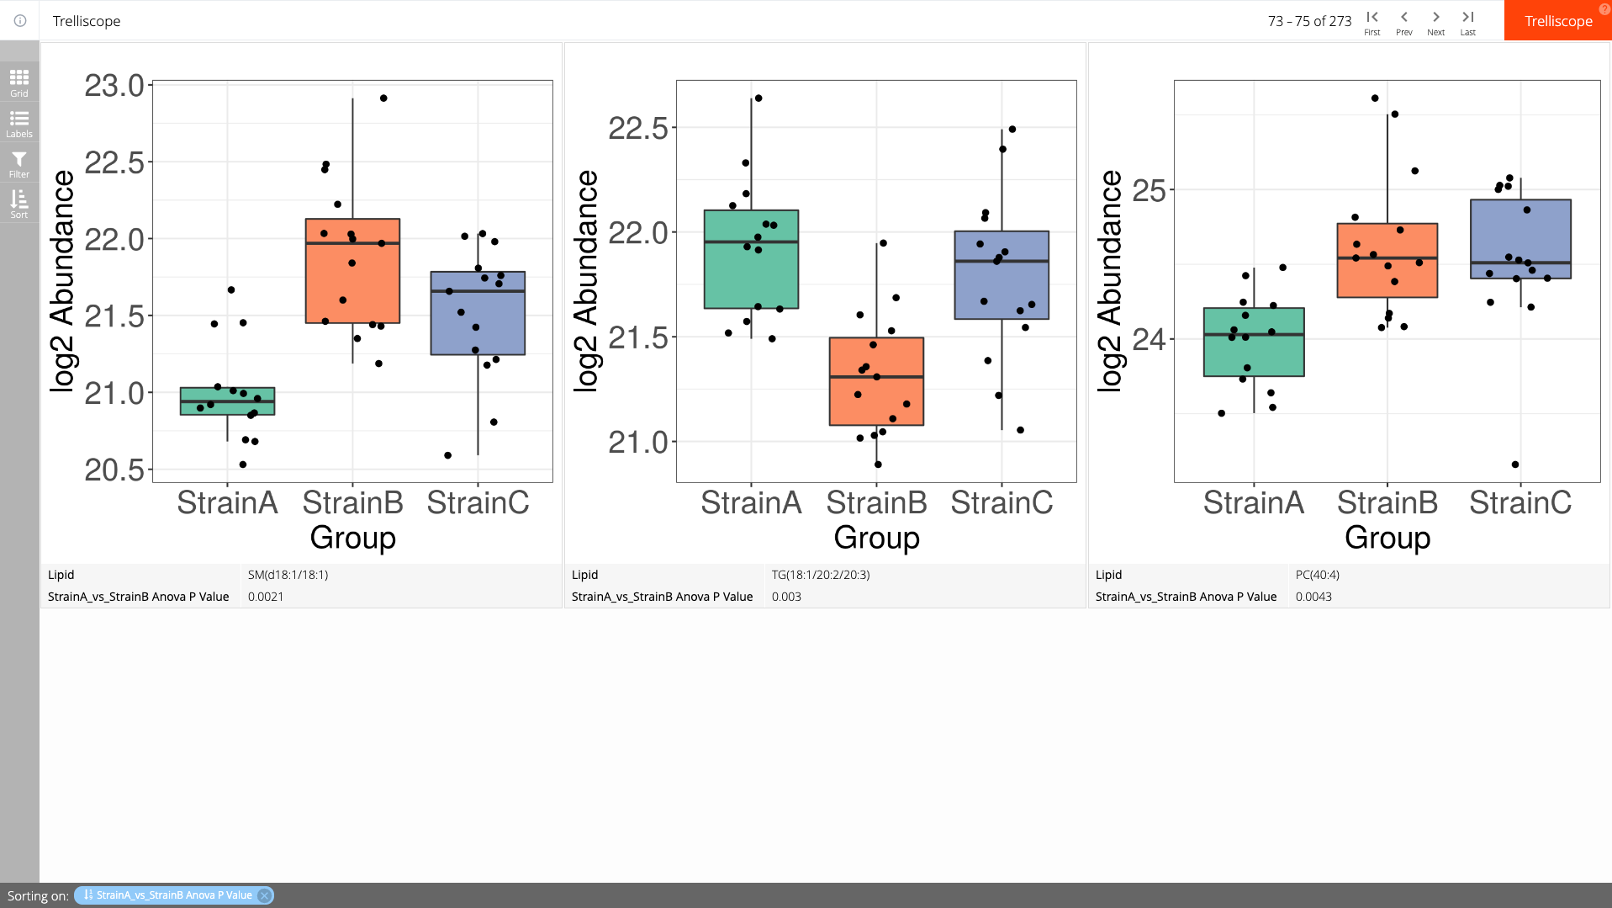
MODE is exceptional at finding trends and creating interactive visual displays. Unlike traditional summary graphs like principal component analysis, which can neglect to show important information and findings, MODE presents detailed visualization of every biomolecule measured and analyzed and aids in prioritizing findings for a user to investigate.
The Environmental Molecular Sciences Laboratory, or EMSL, funded development of MAP and parts of the applications within it. EMSL is a Department of Energy, Office of Science, User Facility sponsored by the Biological and Environmental Research (BER) program. Explore MAP and look for future app releases.
Published: April 3, 2024