Technology Overview
Large-scale industrial facilities, chemical plants, and modern buildings are cooled or heated by an army of connected feedback controllers working in unison. These digital, networked controllers are connected to systems and measurements like central heating and air conditioning, static pressure in ducts, supply air temperature, chilled water temperature supplied from coolers, hot water temperature from boilers, differential pressures across pumps, and more.
Collectively, feedback controllers are foundational in determining a building’s operation and energy efficiency performance. Monitoring and maintaining every controller in a network of thousands can be overwhelming and highly labor-intensive. To further complicate things, there are different types of devices, each providing different performance measurements and volumes of digital data too massive for manual inspection.
Energy efficiency scoring methods have been successfully applied to building consumption, which is foundationally determined by connected energy-using systems. However, no equivalent performance measurement exists for feedback controllers.
Getting Control of Controllers
Most plants and buildings do not reach their energy efficiency potential due to deficiencies in control performance. Operators also have not had access to metrics that can reveal these deficiencies—until now.

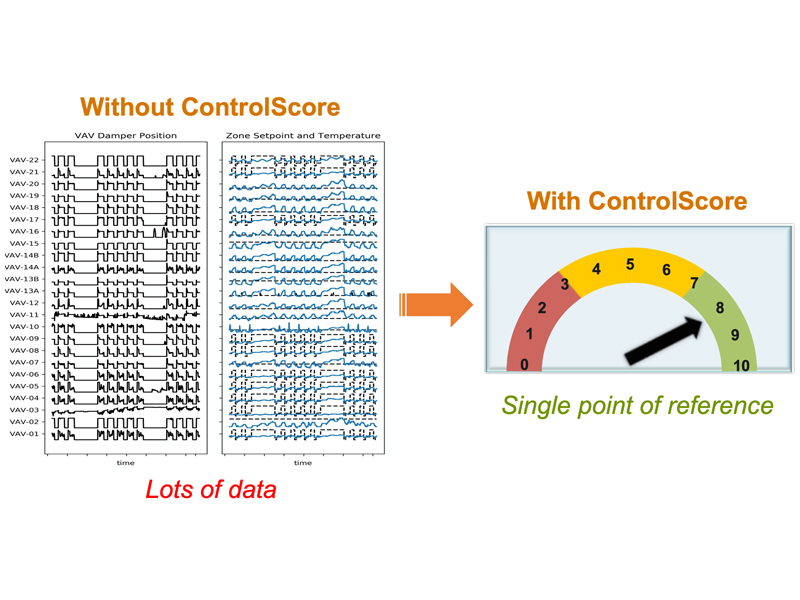
ControlScore is a new software tool developed by researchers at the Pacific Northwest National Laboratory (PNNL). ControlScore will take normal operating data from a building’s control system and generate standardized scores for feedback controllers across the network. With ControlScore, each controller in the building will be assigned a score from 0 to 10, with 10 being the highest rating.
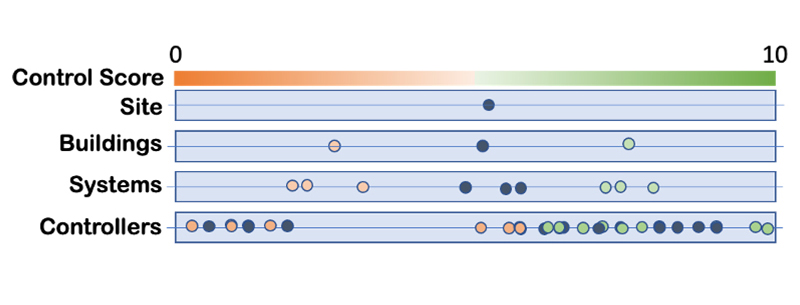
Regardless of the controller type—temperature, flow rate, humidity, or any other measurement—PNNL’s patent-pending algorithm will provide a final score using normal operating data obtained from a building’s control system. Having all of the control scores on the same scale significantly simplifies building management because scores can be grouped to inform the performance of different levels in a building management hierarchy, from individual controllers up to the site level and all levels in between.
The control scores are calculated from readily available trend data either retrieved from a database or streamed live. The scores are based on evaluating both setpoint regulation and supervisory control (setpoint scheduling) and are calculated by combining various statistical probabilities.
The scores will be useful to various levels of building operators and managers. For example, the controller-level scores help direct day-to-day operations and maintenance, and the building- and site-level scores help guide resource investment. Tracked over time, the control scores also can be used to detect changes in performance.
Advantages
First Tool to Score Feedback Controllers, Easy-to-Read Format
ControlScore offers many benefits, including the following:
- Presents control scores to the user in an intuitive manner that does not require deep technical expertise to decipher results.
- Provides valuable insight to meet the needs of an assortment of end users, including high-level buildings and site managers who may be interested in an overall performance dashboard across a portfolio of various buildings.
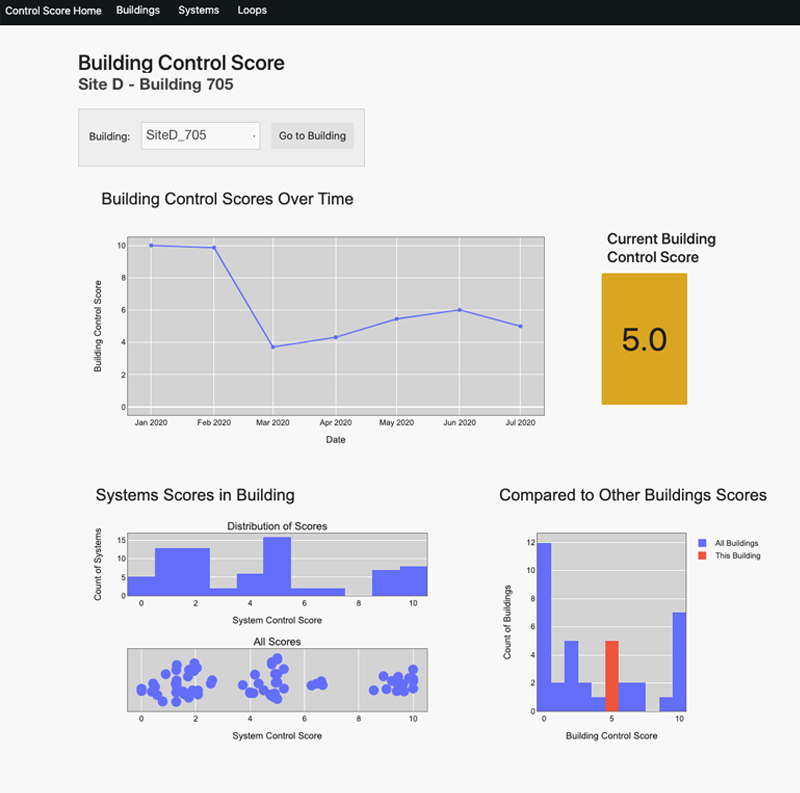
- Intuitive user interface that shows the control scores at every level from individual controllers to entire building portfolios. The web app displays the current score, score history, peer comparison, and component scores for each level.
- Outputs a raw data view, empowering users to diagnose problems and verify issues more consistently.
- Group scores inform the performance of different levels in a building management hierarchy, from an individual controller up to the site level and all levels in between.
State of Development
PNNL’s ControlScore software is available for licensing in all fields of use and would benefit operators of large complex plants, as well as modern buildings and complexes.